Estimated Value: $485,000 - $517,000
3
Beds
1
Bath
1,100
Sq Ft
$455/Sq Ft
Est. Value
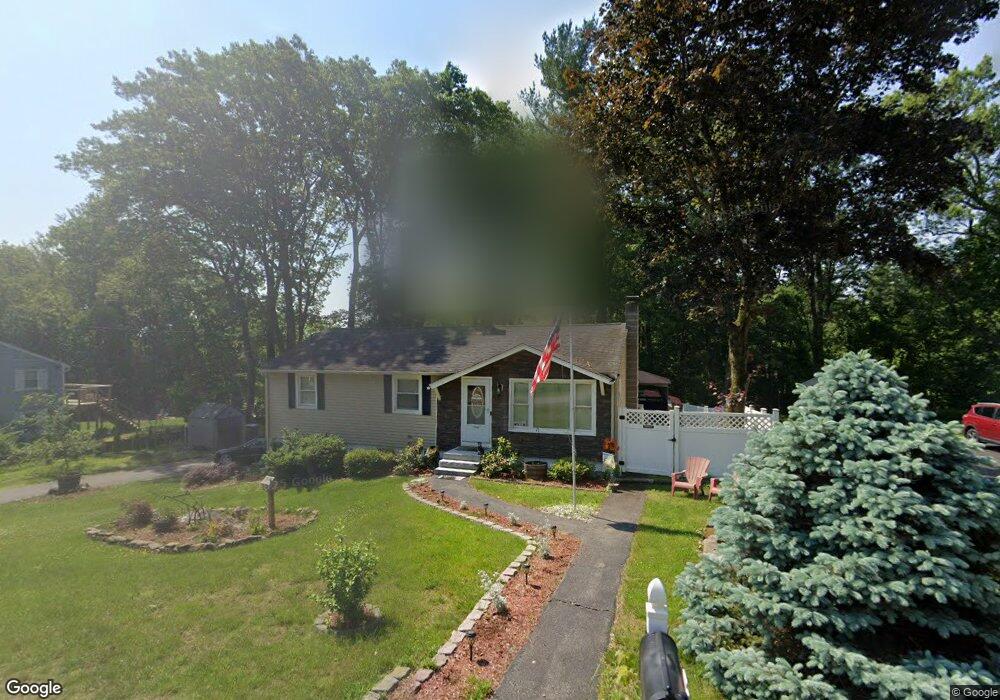
About This Home
This home is located at 9 Gordon Rd, Derry, NH 03038 and is currently estimated at $500,195, approximately $454 per square foot. 9 Gordon Rd is a home located in Rockingham County with nearby schools including South Range Elementary School, West Running Brook Middle School, and Pinkerton Academy.
Ownership History
Date
Name
Owned For
Owner Type
Purchase Details
Closed on
Feb 25, 2011
Sold by
United Capital Investm
Bought by
Starkey Christopher S and Starkey Lisa
Current Estimated Value
Home Financials for this Owner
Home Financials are based on the most recent Mortgage that was taken out on this home.
Original Mortgage
$179,335
Outstanding Balance
$122,989
Interest Rate
4.75%
Mortgage Type
Purchase Money Mortgage
Estimated Equity
$377,207
Purchase Details
Closed on
Jul 9, 2010
Sold by
Fnma
Bought by
United Capital Investm
Purchase Details
Closed on
Mar 25, 2010
Sold by
Coco Alexander G and Fnma
Bought by
Federal National Mortgage Association
Purchase Details
Closed on
Jun 30, 2005
Sold by
Brown-Frisella Faith
Bought by
Shramko Nicole A
Create a Home Valuation Report for This Property
The Home Valuation Report is an in-depth analysis detailing your home's value as well as a comparison with similar homes in the area
Home Values in the Area
Average Home Value in this Area
Purchase History
| Date | Buyer | Sale Price | Title Company |
|---|---|---|---|
| Starkey Christopher S | $184,000 | -- | |
| United Capital Investm | $123,500 | -- | |
| Federal National Mortgage Association | $215,400 | -- | |
| Shramko Nicole A | $246,700 | -- |
Source: Public Records
Mortgage History
| Date | Status | Borrower | Loan Amount |
|---|---|---|---|
| Open | Federal National Mortgage Association | $179,335 | |
| Previous Owner | Federal National Mortgage Association | $210,000 | |
| Previous Owner | Federal National Mortgage Association | $75,000 |
Source: Public Records
Tax History Compared to Growth
Tax History
| Year | Tax Paid | Tax Assessment Tax Assessment Total Assessment is a certain percentage of the fair market value that is determined by local assessors to be the total taxable value of land and additions on the property. | Land | Improvement |
|---|---|---|---|---|
| 2024 | $7,392 | $395,500 | $207,300 | $188,200 |
| 2023 | $7,077 | $342,200 | $176,100 | $166,100 |
| 2022 | $6,504 | $341,600 | $176,100 | $165,500 |
| 2021 | $6,396 | $258,300 | $132,200 | $126,100 |
| 2020 | $2,680 | $258,300 | $132,200 | $126,100 |
| 2019 | $4,986 | $208,300 | $92,100 | $116,200 |
| 2018 | $5,395 | $208,300 | $92,100 | $116,200 |
| 2017 | $2,694 | $181,300 | $82,900 | $98,400 |
| 2016 | $4,906 | $181,300 | $82,900 | $98,400 |
| 2015 | $4,952 | $169,400 | $82,900 | $86,500 |
| 2014 | $4,984 | $169,400 | $82,900 | $86,500 |
| 2013 | $4,997 | $158,700 | $78,300 | $80,400 |
Source: Public Records
Map
Nearby Homes
- 1 Joan St
- 13 Gertrude Rd
- 7 Oakwood St
- 18 Nottingham Rd
- 149 Londonderry Rd
- 171 Londonderry Rd
- 13 Gamache Rd
- 83 Beech Terrace
- 24 Sheffield Way
- 66 Derryfield Rd Unit L
- 5 Elise Ave Unit Lot 94
- 90L Derryfield Rd
- 90L Derryfield Rd Unit L
- 2 Brown Rd
- 11 Park St
- 14 Reed St
- 34 Pleasant Dr
- 12 Morrison Dr
- 18 Hawthorne Rd
- 97 Kendall Pond Rd