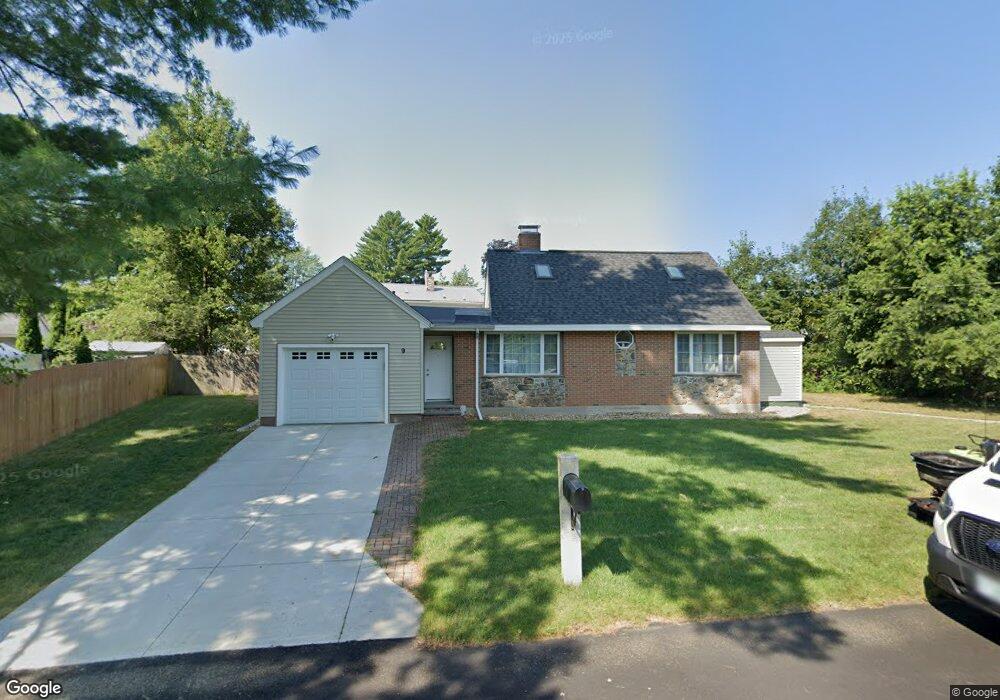
9 Greenlay St Nashua, NH 03063
Northwest Nashua NeighborhoodEstimated Value: $411,000 - $529,000
3
Beds
2
Baths
1,698
Sq Ft
$276/Sq Ft
Est. Value
About This Home
This home is located at 9 Greenlay St, Nashua, NH 03063 and is currently estimated at $469,414, approximately $276 per square foot. 9 Greenlay St is a home located in Hillsborough County with nearby schools including Broad Street Elementary School, Elm Street Middle School, and Nashua High School North.
Ownership History
Date
Name
Owned For
Owner Type
Purchase Details
Closed on
Sep 2, 2010
Sold by
Fhlmc
Bought by
Gordon Rebecca
Current Estimated Value
Home Financials for this Owner
Home Financials are based on the most recent Mortgage that was taken out on this home.
Original Mortgage
$177,509
Outstanding Balance
$115,561
Interest Rate
4.55%
Mortgage Type
Purchase Money Mortgage
Estimated Equity
$353,853
Purchase Details
Closed on
Mar 3, 2010
Sold by
Bedard Mary Lou and Us Bank Na
Bought by
Fhlmc
Purchase Details
Closed on
Mar 31, 2003
Sold by
Hartung Darren R and Hartung Amanda L
Bought by
Bedard Mary Lou
Purchase Details
Closed on
Oct 29, 1999
Sold by
Woodard Kathleen M
Bought by
Hartung Darren R and Hartung Amanda L
Purchase Details
Closed on
Apr 15, 1996
Sold by
Fnma
Bought by
Woodard Kathleen M
Create a Home Valuation Report for This Property
The Home Valuation Report is an in-depth analysis detailing your home's value as well as a comparison with similar homes in the area
Home Values in the Area
Average Home Value in this Area
Purchase History
| Date | Buyer | Sale Price | Title Company |
|---|---|---|---|
| Gordon Rebecca | $180,000 | -- | |
| Fhlmc | $219,100 | -- | |
| Bedard Mary Lou | $221,500 | -- | |
| Hartung Darren R | $128,000 | -- | |
| Woodard Kathleen M | $85,000 | -- |
Source: Public Records
Mortgage History
| Date | Status | Borrower | Loan Amount |
|---|---|---|---|
| Open | Woodard Kathleen M | $177,509 | |
| Previous Owner | Woodard Kathleen M | $212,000 | |
| Previous Owner | Woodard Kathleen M | $33,000 |
Source: Public Records
Tax History
| Year | Tax Paid | Tax Assessment Tax Assessment Total Assessment is a certain percentage of the fair market value that is determined by local assessors to be the total taxable value of land and additions on the property. | Land | Improvement |
|---|---|---|---|---|
| 2025 | $7,257 | $431,200 | $144,300 | $286,900 |
| 2024 | $6,856 | $431,200 | $144,300 | $286,900 |
| 2023 | $6,463 | $354,500 | $115,400 | $239,100 |
| 2022 | $6,406 | $354,500 | $115,400 | $239,100 |
| 2021 | $6,074 | $261,600 | $76,900 | $184,700 |
| 2020 | $5,870 | $259,600 | $76,900 | $182,700 |
| 2019 | $5,649 | $259,600 | $76,900 | $182,700 |
| 2018 | $5,623 | $265,100 | $76,900 | $188,200 |
| 2017 | $5,411 | $209,800 | $63,500 | $146,300 |
| 2016 | $5,260 | $209,800 | $63,500 | $146,300 |
| 2015 | $5,146 | $209,800 | $63,500 | $146,300 |
| 2014 | $5,046 | $209,800 | $63,500 | $146,300 |
Source: Public Records
Map
Nearby Homes
- 24 Hunters Ln
- 77 Dunbarton Dr
- 9 Rugby Rd
- 44 Broad St
- 111 Coburn Ave Unit 187
- 189 Coburn Woods
- 63 Tampa St
- 11 Pine Hill Ave
- 7 Buker St
- 3 Kirk St Unit 57
- 10 Hampton Dr
- 8 Fitzpatrick Cir Unit U79
- 57 Baldwin St
- 13 Cider Ln
- 9 Dale St
- 0 Baldwin St Unit 101, 102, 131, 100
- 5 Ivy Ln Unit U131
- 40 Hollow Ridge Dr
- 169A W Hollis St Unit 193
- 247 Main Dunstable Rd
Your Personal Tour Guide
Ask me questions while you tour the home.