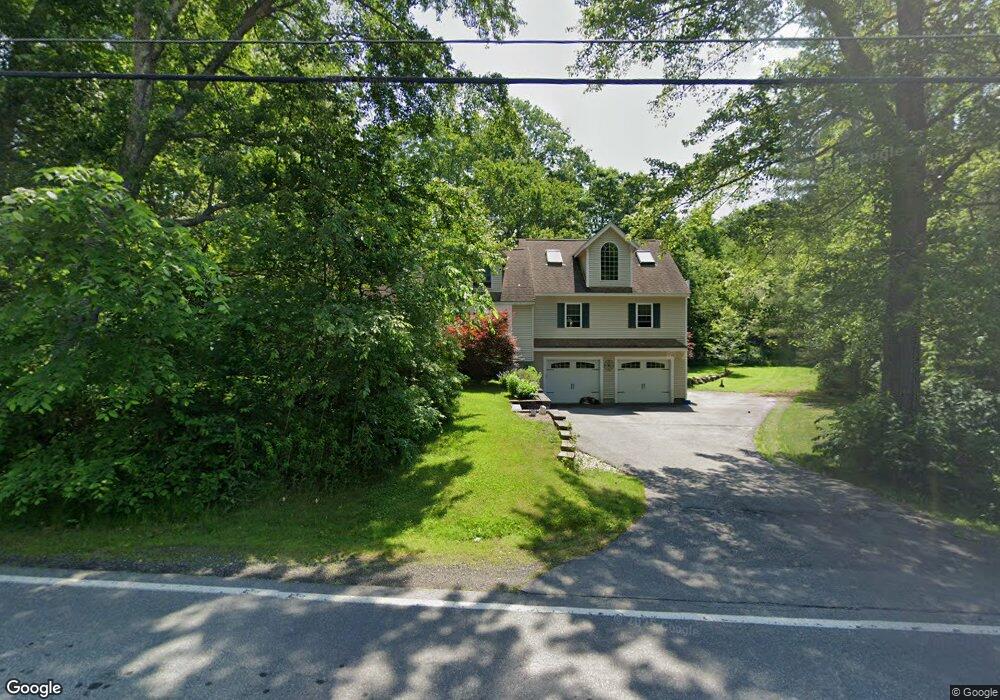
9 Griffin Rd Londonderry, NH 03053
Estimated Value: $568,000 - $629,000
3
Beds
2
Baths
1,260
Sq Ft
$483/Sq Ft
Est. Value
About This Home
This home is located at 9 Griffin Rd, Londonderry, NH 03053 and is currently estimated at $608,017, approximately $482 per square foot. 9 Griffin Rd is a home located in Rockingham County with nearby schools including Londonderry Middle School, Londonderry Senior High School, and Southern New Hampshire Montessori Academy.
Ownership History
Date
Name
Owned For
Owner Type
Purchase Details
Closed on
Nov 22, 2024
Sold by
Millette Kimberly A
Bought by
Lapointe Scott J
Current Estimated Value
Home Financials for this Owner
Home Financials are based on the most recent Mortgage that was taken out on this home.
Original Mortgage
$130,000
Interest Rate
6.81%
Mortgage Type
Second Mortgage Made To Cover Down Payment
Purchase Details
Closed on
Apr 2, 1997
Sold by
Bishop Julie A
Bought by
Lapointe Scott J and Lapointe Kimberly A
Home Financials for this Owner
Home Financials are based on the most recent Mortgage that was taken out on this home.
Original Mortgage
$100,700
Interest Rate
7.5%
Create a Home Valuation Report for This Property
The Home Valuation Report is an in-depth analysis detailing your home's value as well as a comparison with similar homes in the area
Home Values in the Area
Average Home Value in this Area
Purchase History
| Date | Buyer | Sale Price | Title Company |
|---|---|---|---|
| Lapointe Scott J | -- | None Available | |
| Lapointe Scott J | -- | None Available | |
| Lapointe Scott J | $81,000 | -- | |
| Lapointe Scott J | $81,000 | -- |
Source: Public Records
Mortgage History
| Date | Status | Borrower | Loan Amount |
|---|---|---|---|
| Previous Owner | Lapointe Scott J | $130,000 | |
| Previous Owner | Lapointe Scott J | $206,250 | |
| Previous Owner | Lapointe Scott J | $30,000 | |
| Previous Owner | Lapointe Scott J | $100,700 |
Source: Public Records
Tax History Compared to Growth
Tax History
| Year | Tax Paid | Tax Assessment Tax Assessment Total Assessment is a certain percentage of the fair market value that is determined by local assessors to be the total taxable value of land and additions on the property. | Land | Improvement |
|---|---|---|---|---|
| 2024 | $7,384 | $457,500 | $179,900 | $277,600 |
| 2023 | $7,160 | $457,500 | $179,900 | $277,600 |
| 2022 | $7,322 | $396,200 | $134,900 | $261,300 |
| 2021 | $7,282 | $396,200 | $134,900 | $261,300 |
| 2020 | $6,974 | $346,800 | $112,400 | $234,400 |
| 2019 | $6,724 | $346,800 | $112,400 | $234,400 |
| 2018 | $6,444 | $295,600 | $93,700 | $201,900 |
| 2017 | $6,388 | $295,600 | $93,700 | $201,900 |
| 2016 | $5,958 | $277,100 | $93,700 | $183,400 |
| 2015 | $5,825 | $277,100 | $93,700 | $183,400 |
| 2014 | $5,844 | $277,100 | $93,700 | $183,400 |
| 2011 | -- | $281,400 | $93,700 | $187,700 |
Source: Public Records
Map
Nearby Homes