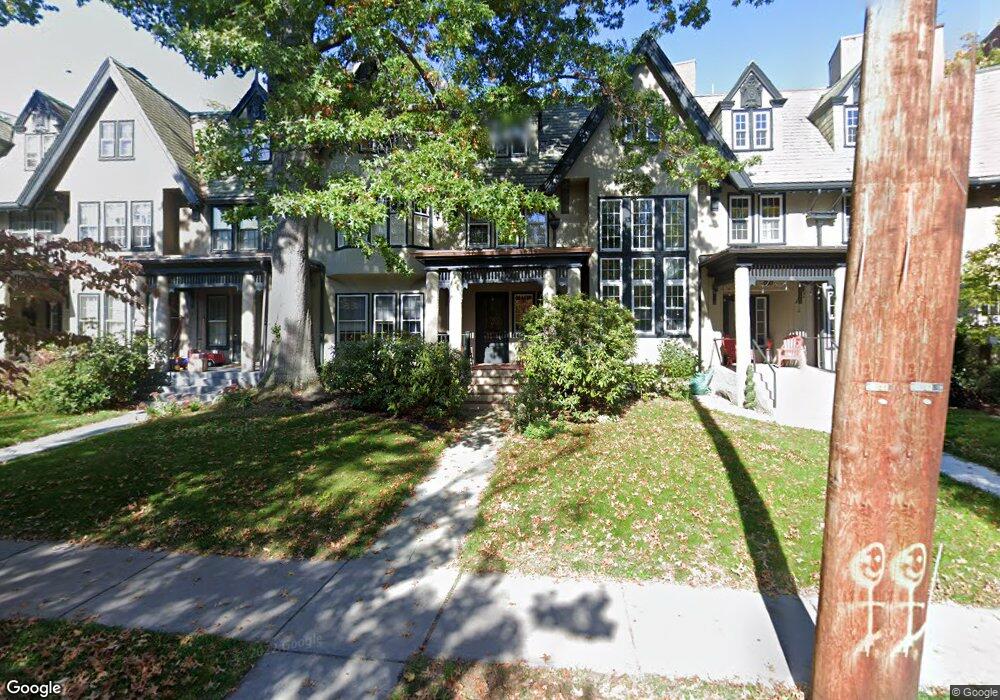
9 Griggs Terrace Brookline, MA 02446
Coolidge Corner NeighborhoodEstimated Value: $2,455,000 - $3,146,000
4
Beds
4
Baths
2,873
Sq Ft
$980/Sq Ft
Est. Value
About This Home
This home is located at 9 Griggs Terrace, Brookline, MA 02446 and is currently estimated at $2,814,805, approximately $979 per square foot. 9 Griggs Terrace is a home located in Norfolk County with nearby schools including Pierce School, Torah Academy, and St. Mary of the Assumption Elementary School.
Ownership History
Date
Name
Owned For
Owner Type
Purchase Details
Closed on
Mar 27, 2025
Sold by
Rgsbn Holdings T and Garonzik
Bought by
Robertson Gayle A and Lopiccolo Gregory B
Current Estimated Value
Purchase Details
Closed on
Dec 6, 2019
Sold by
Garonzik Ron and Garonzik Ben
Bought by
Rgsbn Hldg T
Purchase Details
Closed on
Jun 2, 2003
Sold by
Friend Julie
Bought by
Garonzik Ron and Ben-Natan Shulamit
Purchase Details
Closed on
Jun 15, 2000
Sold by
Kamarck Martin A and Kamarck Elaine C
Bought by
Friend Scott and Friend Julie
Purchase Details
Closed on
Jul 2, 1997
Sold by
Maloney Joan C
Bought by
Kamarck Martin A and Kamarck Elaine C
Create a Home Valuation Report for This Property
The Home Valuation Report is an in-depth analysis detailing your home's value as well as a comparison with similar homes in the area
Home Values in the Area
Average Home Value in this Area
Purchase History
| Date | Buyer | Sale Price | Title Company |
|---|---|---|---|
| Robertson Gayle A | -- | -- | |
| Robertson Gayle A | -- | -- | |
| Rgsbn Hldg T | -- | None Available | |
| Garonzik Ron | $1,200,000 | -- | |
| Garonzik Ron | $1,200,000 | -- | |
| Friend Scott | $890,000 | -- | |
| Kamarck Martin A | $488,000 | -- | |
| Kamarck Martin A | $488,000 | -- |
Source: Public Records
Mortgage History
| Date | Status | Borrower | Loan Amount |
|---|---|---|---|
| Previous Owner | Kamarck Martin A | $412,800 | |
| Previous Owner | Kamarck Martin A | $417,000 | |
| Previous Owner | Kamarck Martin A | $150,000 |
Source: Public Records
Tax History Compared to Growth
Tax History
| Year | Tax Paid | Tax Assessment Tax Assessment Total Assessment is a certain percentage of the fair market value that is determined by local assessors to be the total taxable value of land and additions on the property. | Land | Improvement |
|---|---|---|---|---|
| 2025 | $21,473 | $2,175,600 | $1,014,300 | $1,161,300 |
| 2024 | $20,460 | $2,094,200 | $972,300 | $1,121,900 |
| 2023 | $18,864 | $1,892,100 | $789,500 | $1,102,600 |
| 2022 | $18,361 | $1,801,900 | $751,800 | $1,050,100 |
| 2021 | $16,979 | $1,732,600 | $722,900 | $1,009,700 |
| 2020 | $15,537 | $1,644,100 | $647,100 | $997,000 |
| 2019 | $14,672 | $1,565,800 | $616,300 | $949,500 |
| 2018 | $13,130 | $1,388,000 | $465,400 | $922,600 |
| 2017 | $12,937 | $1,309,400 | $439,100 | $870,300 |
| 2016 | $12,767 | $1,225,200 | $410,300 | $814,900 |
| 2015 | $11,798 | $1,104,700 | $343,200 | $761,500 |
| 2014 | $12,183 | $1,069,600 | $318,000 | $751,600 |
Source: Public Records
Map
Nearby Homes
- 1471 Beacon St Unit 7
- 1471 Beacon St Unit 1
- 80 Vernon St Unit 1-A
- 80 Vernon St Unit 2B
- 80 Vernon St Unit PHA
- 80 Vernon St Unit 3A
- 80 Vernon St Unit 3B
- 15 Short St Unit 4
- 89 Marion St
- 80 Park St Unit 23
- 589-591 Washington St
- 138 Mason Terrace Unit 1
- 119 Park St Unit 7
- 59 Mason Terrace Unit 61
- 19 Winchester St Unit 110
- 4 Fairbanks St Unit 2
- 21 Hancock Rd
- 29 Mason Terrace
- 24 Auburn St Unit 1
- 24 Auburn St Unit 2
- 10 Griggs Terrace
- 8 Griggs Terrace
- 7 Griggs Terrace
- 11 Griggs Terrace
- 6 Griggs Terrace
- 12 Griggs Terrace Unit 12A
- 13 Griggs Terrace Unit 13
- 1459 Beacon St Unit 4
- 1459 Beacon St Unit 40
- 1459 Beacon St Unit 201
- 1459 Beacon St Unit 31
- 1459 Beacon St Unit 1463 - 3
- 1459 Beacon St
- 1459 Beacon St Unit 202
- 1459 Beacon St Unit 102
- 1459 Beacon St Unit 42
- 1459 Beacon St
- 59 Griggs Rd
- 1463 Beacon St Unit 4
- 1463 Beacon St Unit 11