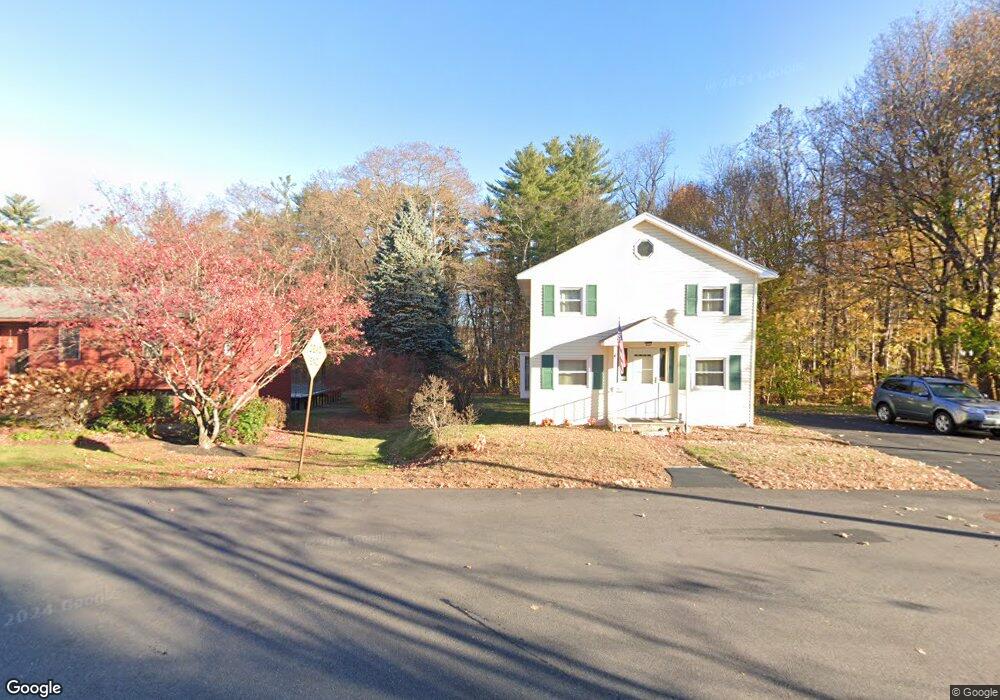
9 Hale St Exeter, NH 03833
Estimated Value: $482,000 - $540,480
3
Beds
1
Bath
1,242
Sq Ft
$407/Sq Ft
Est. Value
About This Home
This home is located at 9 Hale St, Exeter, NH 03833 and is currently estimated at $505,120, approximately $406 per square foot. 9 Hale St is a home located in Rockingham County with nearby schools including Main Street School, Lincoln Street Elementary School, and Cooperative Middle School.
Ownership History
Date
Name
Owned For
Owner Type
Purchase Details
Closed on
Nov 18, 2020
Sold by
Ohearn David A and Ohearn Karen F
Bought by
D & K Ohearn Ft
Current Estimated Value
Purchase Details
Closed on
Mar 16, 1999
Sold by
Rubin Kenneth L and Rubin Sandra R
Bought by
Ohearn David A and Ohearn Karen F
Home Financials for this Owner
Home Financials are based on the most recent Mortgage that was taken out on this home.
Original Mortgage
$120,600
Interest Rate
6.73%
Create a Home Valuation Report for This Property
The Home Valuation Report is an in-depth analysis detailing your home's value as well as a comparison with similar homes in the area
Home Values in the Area
Average Home Value in this Area
Purchase History
| Date | Buyer | Sale Price | Title Company |
|---|---|---|---|
| D & K Ohearn Ft | -- | None Available | |
| Ohearn David A | $134,000 | -- |
Source: Public Records
Mortgage History
| Date | Status | Borrower | Loan Amount |
|---|---|---|---|
| Previous Owner | Ohearn David A | $100,000 | |
| Previous Owner | Ohearn David A | $85,000 | |
| Previous Owner | Ohearn David A | $120,600 |
Source: Public Records
Tax History Compared to Growth
Tax History
| Year | Tax Paid | Tax Assessment Tax Assessment Total Assessment is a certain percentage of the fair market value that is determined by local assessors to be the total taxable value of land and additions on the property. | Land | Improvement |
|---|---|---|---|---|
| 2024 | $8,308 | $467,000 | $252,300 | $214,700 |
| 2023 | $7,330 | $273,700 | $148,400 | $125,300 |
| 2022 | $6,774 | $273,700 | $148,400 | $125,300 |
| 2021 | $6,572 | $273,700 | $148,400 | $125,300 |
| 2020 | $6,703 | $273,700 | $148,400 | $125,300 |
| 2019 | $6,369 | $273,700 | $148,400 | $125,300 |
| 2018 | $6,251 | $227,300 | $109,100 | $118,200 |
| 2017 | $6,025 | $226,600 | $109,100 | $117,500 |
| 2016 | $5,946 | $226,600 | $109,100 | $117,500 |
| 2015 | $5,787 | $226,600 | $109,100 | $117,500 |
| 2014 | $6,273 | $240,700 | $109,200 | $131,500 |
| 2013 | $6,265 | $240,700 | $109,200 | $131,500 |
| 2011 | $6,085 | $240,700 | $109,200 | $131,500 |
Source: Public Records
Map
Nearby Homes
- 50 Brookside Dr Unit 3
- 50 Brookside Dr Unit A5
- 50 Brookside Dr Unit N6
- 4 Brookside Dr Unit 6
- 4 Brookside Dr Unit 10
- 1 Brookside Dr Unit 2
- 24 Wadleigh St Unit 4
- 72 Wadleigh St Unit 38
- 96 Wadleigh St Unit 31
- 709 Nottingham Dr
- 69 Main St Unit G
- 48 Winter St
- 27 Tremont St
- 27-29 Tremont St
- 17-19 Dartmouth St
- 13 Little River Rd Unit lot 2
- 10 Little River Rd Unit Lot 6
- 12 Tanya Ln
- 9 School St
- 115 Front St