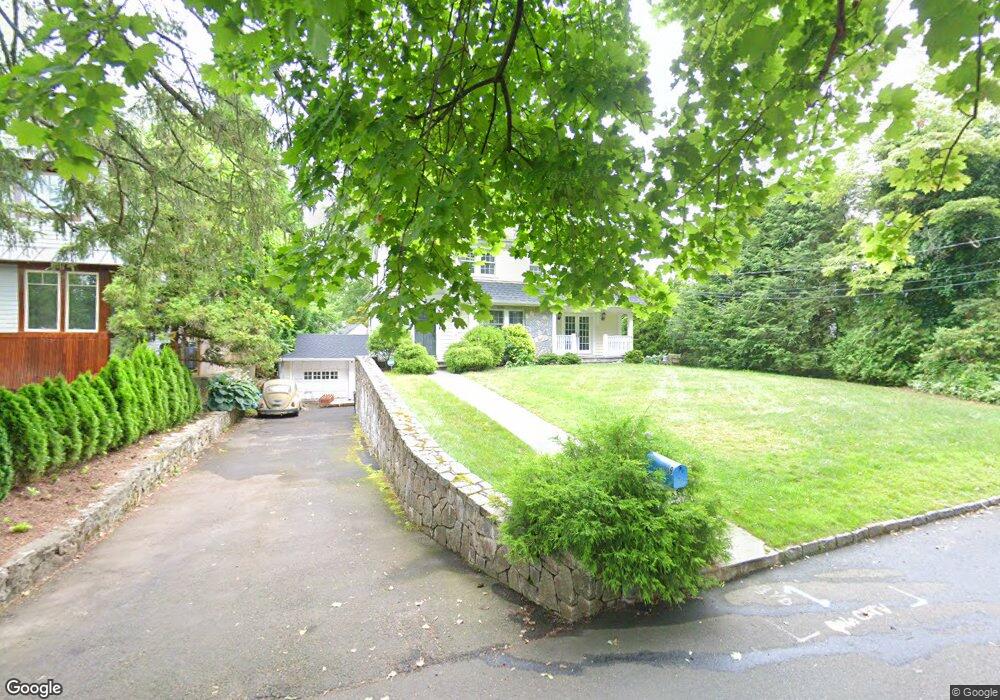
9 Hidden Brook Rd Riverside, CT 06878
Estimated Value: $2,462,000 - $2,884,000
4
Beds
3
Baths
2,462
Sq Ft
$1,105/Sq Ft
Est. Value
About This Home
This home is located at 9 Hidden Brook Rd, Riverside, CT 06878 and is currently estimated at $2,721,357, approximately $1,105 per square foot. 9 Hidden Brook Rd is a home located in Fairfield County with nearby schools including Riverside School, Eastern Middle School, and Greenwich High School.
Ownership History
Date
Name
Owned For
Owner Type
Purchase Details
Closed on
May 23, 1996
Sold by
First Union Bank Ct Tr
Bought by
Berzolla Christopher A and Verso Donna M
Current Estimated Value
Home Financials for this Owner
Home Financials are based on the most recent Mortgage that was taken out on this home.
Original Mortgage
$400,000
Interest Rate
8.01%
Mortgage Type
Unknown
Create a Home Valuation Report for This Property
The Home Valuation Report is an in-depth analysis detailing your home's value as well as a comparison with similar homes in the area
Home Values in the Area
Average Home Value in this Area
Purchase History
| Date | Buyer | Sale Price | Title Company |
|---|---|---|---|
| Berzolla Christopher A | $500,000 | -- | |
| Berzolla Christopher A | $500,000 | -- |
Source: Public Records
Mortgage History
| Date | Status | Borrower | Loan Amount |
|---|---|---|---|
| Open | Berzolla Christopher A | $375,000 | |
| Closed | Berzolla Christopher A | $400,000 |
Source: Public Records
Tax History
| Year | Tax Paid | Tax Assessment Tax Assessment Total Assessment is a certain percentage of the fair market value that is determined by local assessors to be the total taxable value of land and additions on the property. | Land | Improvement |
|---|---|---|---|---|
| 2025 | $14,736 | $1,192,310 | $925,750 | $266,560 |
| 2024 | $14,231 | $1,192,310 | $925,750 | $266,560 |
| 2023 | $13,874 | $1,192,310 | $925,750 | $266,560 |
| 2022 | $13,747 | $1,192,310 | $925,750 | $266,560 |
| 2021 | $12,828 | $1,065,470 | $761,110 | $304,360 |
| 2020 | $12,807 | $1,065,470 | $761,110 | $304,360 |
| 2019 | $12,935 | $1,065,470 | $761,110 | $304,360 |
| 2018 | $12,647 | $1,065,470 | $761,110 | $304,360 |
| 2017 | $12,806 | $1,065,470 | $761,110 | $304,360 |
| 2016 | $12,603 | $1,065,470 | $761,110 | $304,360 |
| 2015 | $9,853 | $826,280 | $743,960 | $82,320 |
| 2014 | $9,606 | $826,280 | $743,960 | $82,320 |
Source: Public Records
Map
Nearby Homes
Your Personal Tour Guide
Ask me questions while you tour the home.