9 High Fields Dr Danbury, CT 06811
Estimated Value: $892,000 - $1,037,000
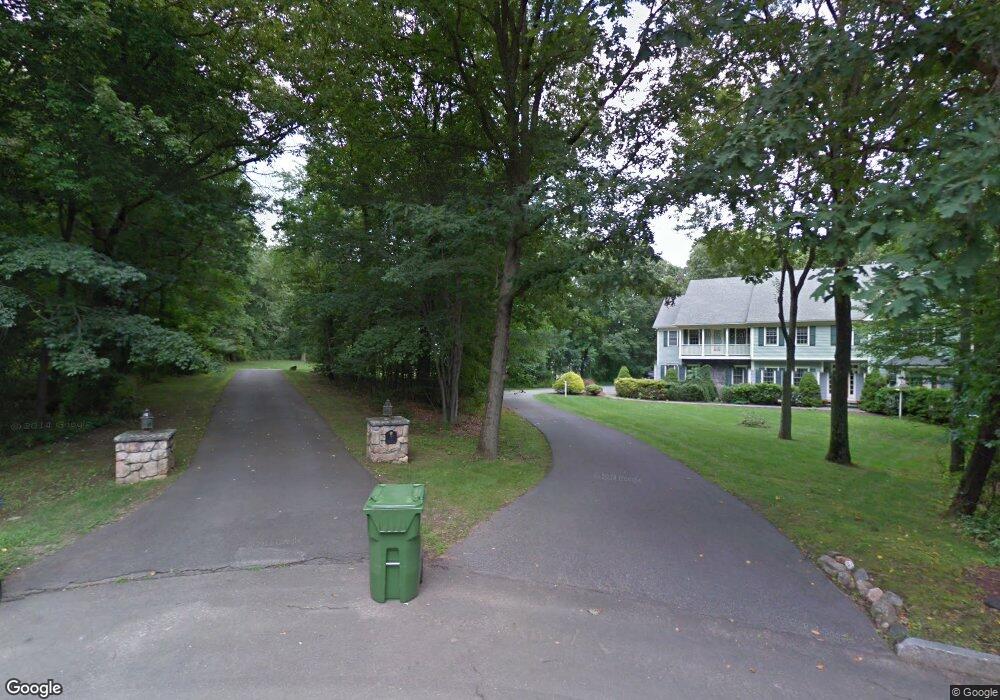
About This Home
This home is located at 9 High Fields Dr, Danbury, CT 06811 and is currently estimated at $945,904, approximately $255 per square foot. 9 High Fields Dr is a home located in Fairfield County with nearby schools including King Street Primary School, Rogers Park Middle School, and Danbury High School.
Ownership History
We collect this data history from publicly available records. To have your information removed, we recommend requesting removal directly through your county’s website.
Purchase Details
Purchase Details
Purchase Details
Home Values in the Area
Average Home Value in this Area
Purchase History
We collect this data history from publicly available records. To have your information removed, we recommend requesting removal directly through your county’s website.
| Date | Buyer | Sale Price | Title Company |
|---|---|---|---|
| -- | -- | ||
| $300,000 | -- | ||
| $710,000 | -- | ||
| $817,000 | -- |
Mortgage History
We collect this data history from publicly available records. To have your information removed, we recommend requesting removal directly through your county’s website.
| Date | Status | Borrower | Loan Amount |
|---|---|---|---|
| Previous Owner | $68,000 |
Tax History
We collect this data history from publicly available records. To have your information removed, we recommend requesting removal directly through your county’s website.
| Year | Tax Paid | Tax Assessment Tax Assessment Total Assessment is a certain percentage of the fair market value that is determined by local assessors to be the total taxable value of land and additions on the property. | Land | Improvement |
|---|---|---|---|---|
| 2025 | $13,529 | $541,380 | $127,260 | $414,120 |
| 2024 | $13,231 | $541,380 | $127,260 | $414,120 |
| 2023 | $12,630 | $541,380 | $127,260 | $414,120 |
| 2022 | $13,515 | $478,900 | $132,400 | $346,500 |
| 2021 | $13,218 | $478,900 | $132,400 | $346,500 |
| 2020 | $5,205 | $478,900 | $132,400 | $346,500 |
| 2019 | $13,218 | $478,900 | $132,400 | $346,500 |
| 2018 | $5,089 | $478,900 | $132,400 | $346,500 |
| 2017 | $13,097 | $452,400 | $126,100 | $326,300 |
| 2016 | $12,975 | $452,400 | $126,100 | $326,300 |
| 2015 | $12,785 | $452,400 | $126,100 | $326,300 |
| 2014 | $12,486 | $452,400 | $126,100 | $326,300 |
Map
- 88 S King St
- 20 Judith Dr
- 56 Judith Dr
- 12 Heritage Dr
- 2 Judith Dr
- 133 Chambers Rd Unit 135
- 163 Clapboard Ridge Rd
- 33 King St
- 159 Clapboard Ridge Rd
- 6 Dogwood Park N
- 9 Damia Dr
- 9 Delno Dr
- 13 King St
- 95 Clapboard Ridge Rd
- 31 Hillandale Rd
- 21 Dogwood Dr
- 45 E Gate Rd
- 1 Rockwood Ln
- 14 Elmcrest Dr
- 7 Mohawk Cir
Ask me questions while you tour the home.