Estimated Value: $329,549 - $458,000
2
Beds
1
Bath
760
Sq Ft
$538/Sq Ft
Est. Value
About This Home
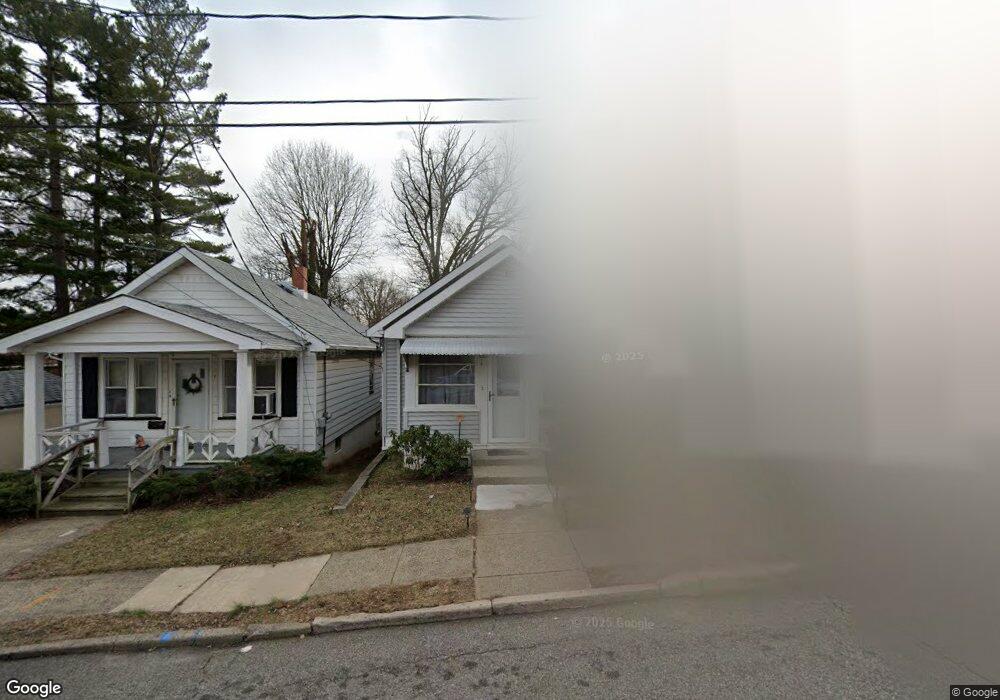
This home is located at 9 Hollister Place, Fords, NJ 08863 and is currently estimated at $408,637, approximately $537 per square foot. 9 Hollister Place is a home located in Middlesex County with nearby schools including Ford Avenue Elementary School, Fords Middle School, and Woodbridge High School.
Ownership History
Date
Name
Owned For
Owner Type
Purchase Details
Closed on
Jun 14, 2022
Sold by
Anne Gorski Jodimarie
Bought by
Urso Jennifer Mary
Current Estimated Value
Home Financials for this Owner
Home Financials are based on the most recent Mortgage that was taken out on this home.
Original Mortgage
$115,000
Outstanding Balance
$109,451
Interest Rate
5.3%
Mortgage Type
New Conventional
Estimated Equity
$299,186
Purchase Details
Closed on
Nov 2, 2017
Sold by
Borg Clyde L and Borg Theresa
Bought by
Gorski Jodimarie Anne
Home Financials for this Owner
Home Financials are based on the most recent Mortgage that was taken out on this home.
Original Mortgage
$176,739
Interest Rate
4.12%
Mortgage Type
FHA
Purchase Details
Closed on
Oct 20, 2000
Sold by
Madsen Alfred
Bought by
Borg Clyde and Borg Theresa
Create a Home Valuation Report for This Property
The Home Valuation Report is an in-depth analysis detailing your home's value as well as a comparison with similar homes in the area
Home Values in the Area
Average Home Value in this Area
Purchase History
| Date | Buyer | Sale Price | Title Company |
|---|---|---|---|
| Urso Jennifer Mary | $365,000 | None Listed On Document | |
| Gorski Jodimarie Anne | $180,000 | None Available | |
| Borg Clyde | $118,500 | -- |
Source: Public Records
Mortgage History
| Date | Status | Borrower | Loan Amount |
|---|---|---|---|
| Open | Urso Jennifer Mary | $115,000 | |
| Previous Owner | Gorski Jodimarie Anne | $176,739 |
Source: Public Records
Tax History Compared to Growth
Tax History
| Year | Tax Paid | Tax Assessment Tax Assessment Total Assessment is a certain percentage of the fair market value that is determined by local assessors to be the total taxable value of land and additions on the property. | Land | Improvement |
|---|---|---|---|---|
| 2025 | $7,008 | $55,500 | $15,900 | $39,600 |
| 2024 | $6,804 | $55,500 | $15,900 | $39,600 |
| 2023 | $6,804 | $55,500 | $15,900 | $39,600 |
| 2022 | $5,774 | $48,400 | $15,900 | $32,500 |
| 2021 | $5,714 | $48,400 | $15,900 | $32,500 |
| 2020 | $5,528 | $48,400 | $15,900 | $32,500 |
| 2019 | $5,386 | $48,400 | $15,900 | $32,500 |
| 2018 | $5,279 | $48,400 | $15,900 | $32,500 |
| 2017 | $5,101 | $47,600 | $15,900 | $31,700 |
| 2016 | $5,059 | $47,600 | $15,900 | $31,700 |
| 2015 | $4,960 | $47,600 | $15,900 | $31,700 |
| 2014 | $4,852 | $47,600 | $15,900 | $31,700 |
Source: Public Records
Map
Nearby Homes
- 7 Hollister Place
- 11 Hollister Place
- 15 Hollister Place
- 153 Ford Ave
- 147 Ford Ave
- 157 Ford Ave
- 19 Hollister Place
- 18 Hollister Place
- 159 Ford Ave
- 23 Hollister Place
- 22 Hollister Place
- 169 Ford Ave
- 143 Ford Ave
- 25 Hollister Place
- 16 Evergreen Ave
- 22 Evergreen Ave
- 141 Ford Ave
- 20 Evergreen Ave
- 26 Evergreen Ave
- 27 Hollister Place