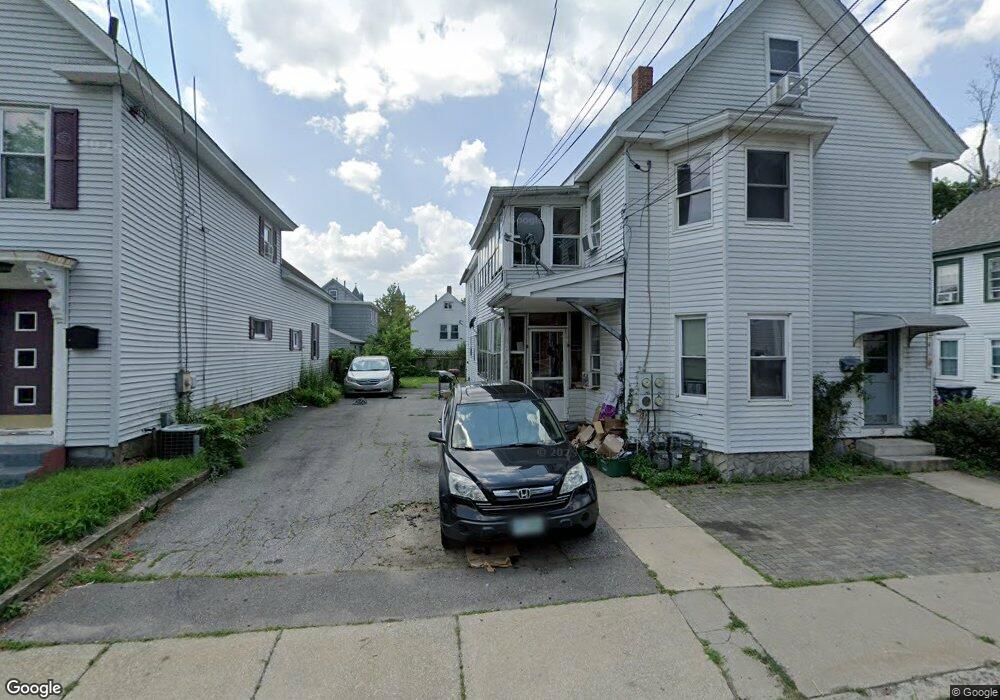
9 Holmes St Nashua, NH 03060
Downtown Nashua NeighborhoodEstimated Value: $506,000 - $615,000
6
Beds
3
Baths
2,544
Sq Ft
$224/Sq Ft
Est. Value
About This Home
This home is located at 9 Holmes St, Nashua, NH 03060 and is currently estimated at $570,667, approximately $224 per square foot. 9 Holmes St is a home located in Hillsborough County with nearby schools including Amherst Street School, Pennichuck Middle School, and Nashua High School North.
Ownership History
Date
Name
Owned For
Owner Type
Purchase Details
Closed on
Jan 4, 2019
Sold by
Pepi Victor A and Pepi Leslie M
Bought by
Pepi Ft and Pepi
Current Estimated Value
Purchase Details
Closed on
Mar 22, 2010
Sold by
Bank Of America Na Tr
Bought by
Pepi Victor A and Pepi Leslie M
Home Financials for this Owner
Home Financials are based on the most recent Mortgage that was taken out on this home.
Original Mortgage
$132,675
Interest Rate
5.05%
Mortgage Type
Purchase Money Mortgage
Purchase Details
Closed on
Feb 2, 2010
Sold by
Decastro Renato and Bank Of America Na Tr
Bought by
Bank Of America Na Tr
Home Financials for this Owner
Home Financials are based on the most recent Mortgage that was taken out on this home.
Original Mortgage
$132,675
Interest Rate
5.05%
Mortgage Type
Purchase Money Mortgage
Purchase Details
Closed on
May 16, 2006
Sold by
Poulin Renald A and Poulin Jeannette L
Bought by
Decastro Renato
Home Financials for this Owner
Home Financials are based on the most recent Mortgage that was taken out on this home.
Original Mortgage
$355,000
Interest Rate
6.4%
Mortgage Type
Purchase Money Mortgage
Create a Home Valuation Report for This Property
The Home Valuation Report is an in-depth analysis detailing your home's value as well as a comparison with similar homes in the area
Home Values in the Area
Average Home Value in this Area
Purchase History
| Date | Buyer | Sale Price | Title Company |
|---|---|---|---|
| Pepi Ft | -- | -- | |
| Pepi Victor A | $176,900 | -- | |
| Bank Of America Na Tr | $165,000 | -- | |
| Decastro Renato | $355,000 | -- |
Source: Public Records
Mortgage History
| Date | Status | Borrower | Loan Amount |
|---|---|---|---|
| Previous Owner | Decastro Renato | $137,000 | |
| Previous Owner | Decastro Renato | $132,675 | |
| Previous Owner | Decastro Renato | $355,000 | |
| Previous Owner | Decastro Renato | $211,000 |
Source: Public Records
Tax History Compared to Growth
Tax History
| Year | Tax Paid | Tax Assessment Tax Assessment Total Assessment is a certain percentage of the fair market value that is determined by local assessors to be the total taxable value of land and additions on the property. | Land | Improvement |
|---|---|---|---|---|
| 2024 | $7,549 | $474,800 | $120,200 | $354,600 |
| 2023 | $7,059 | $387,200 | $96,200 | $291,000 |
| 2022 | $6,997 | $387,200 | $96,200 | $291,000 |
| 2021 | $5,766 | $248,300 | $60,900 | $187,400 |
| 2020 | $5,619 | $248,500 | $60,900 | $187,600 |
| 2019 | $5,407 | $248,500 | $60,900 | $187,600 |
| 2018 | $5,271 | $248,500 | $60,900 | $187,600 |
| 2017 | $7,054 | $157,600 | $60,100 | $97,500 |
| 2016 | $7,000 | $157,600 | $60,100 | $97,500 |
| 2015 | $3,866 | $157,600 | $60,100 | $97,500 |
| 2014 | $3,790 | $157,600 | $60,100 | $97,500 |
Source: Public Records
Map
Nearby Homes
- 18 Harbor Ave Unit 208
- 5 Mulberry St
- 24 E Otterson St
- 13 Mulvanity St
- 8 Buck St Unit 10
- 2 Lyons St
- 38 Central St
- 65 Allds St
- 13 Sapphire Ln
- 30 Ledge St
- 4 Chase St
- 11 Charles St
- 22 Wilder St
- 15 Atherton Ave
- 121 Palm St
- 19 Atherton Ave
- 29 Wilder St
- 15 Lovell St Unit 20
- 15 Lovell St Unit 3
- 15 Lovell St Unit 7