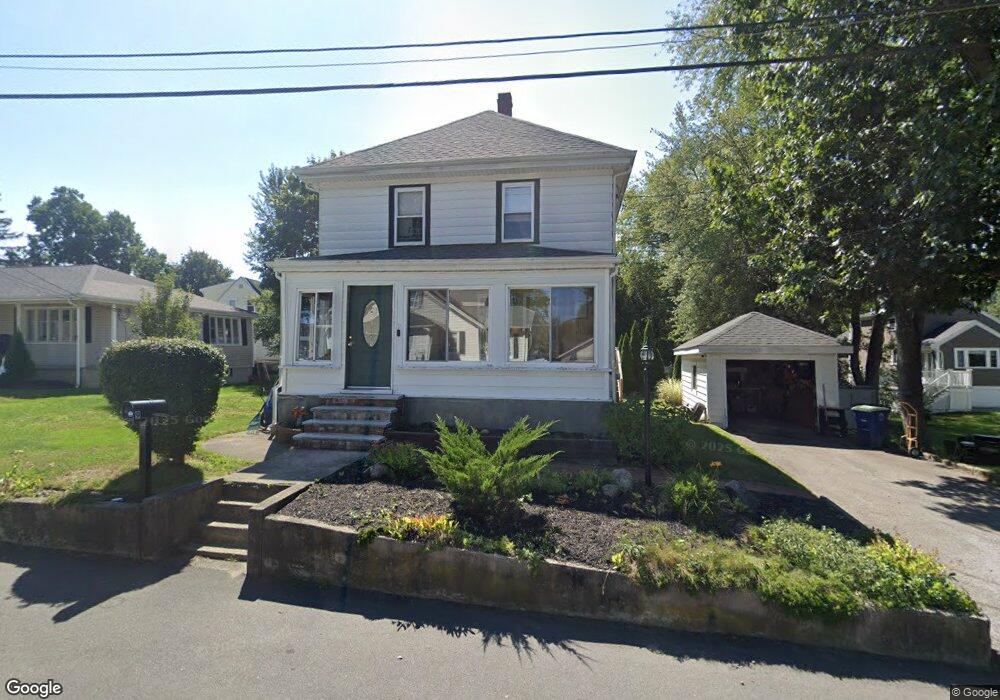
9 Hoover Ave Braintree, MA 02184
South Braintree NeighborhoodEstimated Value: $660,064 - $694,000
3
Beds
2
Baths
1,287
Sq Ft
$527/Sq Ft
Est. Value
About This Home
This home is located at 9 Hoover Ave, Braintree, MA 02184 and is currently estimated at $678,766, approximately $527 per square foot. 9 Hoover Ave is a home located in Norfolk County with nearby schools including Braintree High School, Thayer Academy, and South Shore SDA School.
Ownership History
Date
Name
Owned For
Owner Type
Purchase Details
Closed on
Nov 4, 2013
Sold by
Loschiavo Stephen and Loschiavo Debra L
Bought by
Loschiavo Stephen
Current Estimated Value
Purchase Details
Closed on
Jun 1, 1992
Sold by
Carlino Paul D and Carlino Daniel A
Bought by
Loschiavo Stephen and Loschiavo Debra L
Create a Home Valuation Report for This Property
The Home Valuation Report is an in-depth analysis detailing your home's value as well as a comparison with similar homes in the area
Home Values in the Area
Average Home Value in this Area
Purchase History
| Date | Buyer | Sale Price | Title Company |
|---|---|---|---|
| Loschiavo Stephen | -- | -- | |
| Loschiavo Stephen | $140,000 | -- |
Source: Public Records
Mortgage History
| Date | Status | Borrower | Loan Amount |
|---|---|---|---|
| Open | Loschiavo Stephen | $242,300 | |
| Previous Owner | Loschiavo Stephen | $237,000 | |
| Previous Owner | Loschiavo Stephen | $142,000 |
Source: Public Records
Tax History Compared to Growth
Tax History
| Year | Tax Paid | Tax Assessment Tax Assessment Total Assessment is a certain percentage of the fair market value that is determined by local assessors to be the total taxable value of land and additions on the property. | Land | Improvement |
|---|---|---|---|---|
| 2025 | $5,644 | $565,500 | $323,800 | $241,700 |
| 2024 | $5,107 | $538,700 | $301,900 | $236,800 |
| 2023 | $4,836 | $495,500 | $271,300 | $224,200 |
| 2022 | $4,669 | $469,200 | $245,000 | $224,200 |
| 2021 | $4,309 | $433,100 | $221,400 | $211,700 |
| 2020 | $3,985 | $404,200 | $201,300 | $202,900 |
| 2019 | $3,845 | $381,100 | $192,500 | $188,600 |
| 2018 | $3,752 | $356,000 | $175,000 | $181,000 |
| 2017 | $3,623 | $337,300 | $166,300 | $171,000 |
| 2016 | $3,340 | $304,200 | $140,000 | $164,200 |
| 2015 | $3,286 | $296,800 | $138,300 | $158,500 |
| 2014 | $3,122 | $273,400 | $126,000 | $147,400 |
Source: Public Records
Map
Nearby Homes
- 57 Graziano Dr
- 26 Sherman Rd
- 7 Carter Rd
- 131 Jefferson St
- 17 Royal Lake Dr Unit 4
- 80 Lake St
- 145 Hancock St Unit 214
- 6 Franklin St
- 1307 Washington St
- 15 Highland Ave
- 65 Tremont St
- 56 Plain St
- 614 Pond St Unit 1405
- 614 Pond St Unit 2104
- 614 Pond St Unit 2305
- 614 Pond St Unit 1217
- 305 Franklin St
- 420 John Mahar Hwy Unit 202
- 418 John Mahar Hwy Unit 408
- 422 John Mahar Hwy Unit 305
- 3 Hoover Ave
- 15 Hoover Ave
- 27 Saint Michael Rd
- 12 Hoover Ave
- 29 Saint Michael Rd
- 42 Logan Rd
- 33 Saint Michael Rd
- 26 Logan Rd
- 14 Hoover Ave
- 65 Wayne Ave
- 33 Logan Rd
- 25 Hoover Ave
- 37 Saint Michael Rd
- 12 Saint Michael Rd
- 45 Logan Rd
- 49 Wayne Ave
- 30 Saint Michael Rd
- 56 Logan Rd
- 33 Hoover Ave
- 27 Torrey Rd