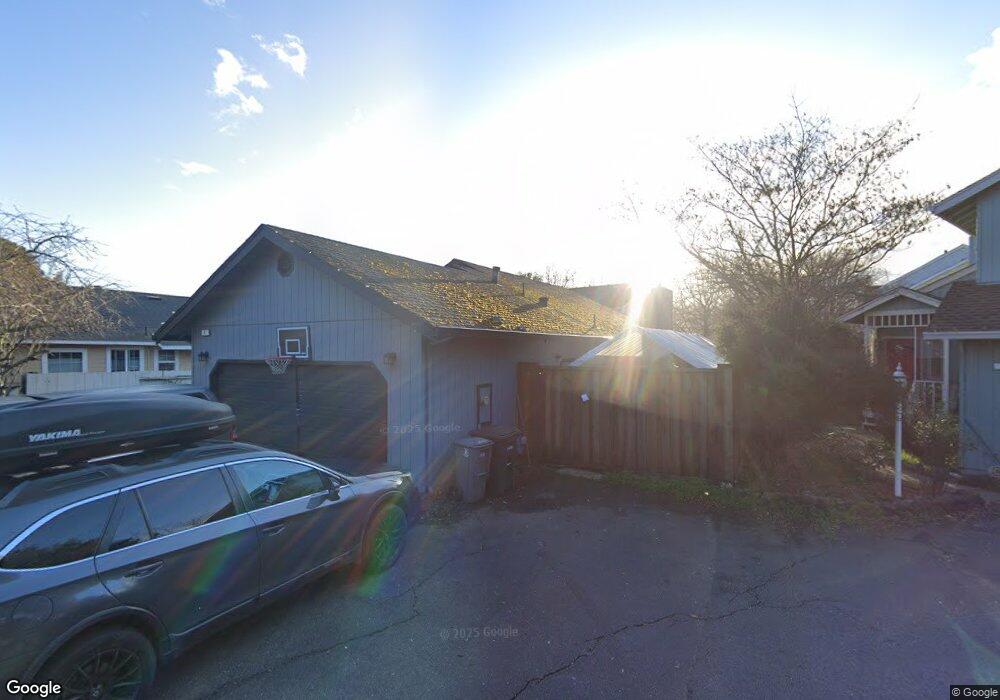
9 Hull St Santa Rosa, CA 95401
Estimated Value: $578,000 - $629,000
3
Beds
2
Baths
1,168
Sq Ft
$515/Sq Ft
Est. Value
About This Home
This home is located at 9 Hull St, Santa Rosa, CA 95401 and is currently estimated at $601,359, approximately $514 per square foot. 9 Hull St is a home located in Sonoma County with nearby schools including Elsie Allen High School, Kid Street Charter School, and St. Michael's Orthodox School.
Ownership History
Date
Name
Owned For
Owner Type
Purchase Details
Closed on
Dec 16, 2014
Sold by
Grady Jennifer
Bought by
Grady Jonathan P
Current Estimated Value
Home Financials for this Owner
Home Financials are based on the most recent Mortgage that was taken out on this home.
Original Mortgage
$292,000
Outstanding Balance
$224,328
Interest Rate
4%
Mortgage Type
New Conventional
Estimated Equity
$377,031
Purchase Details
Closed on
Jun 9, 2008
Sold by
Rogers Kay F
Bought by
Kay F Rogers 2008 Revocable Trust
Create a Home Valuation Report for This Property
The Home Valuation Report is an in-depth analysis detailing your home's value as well as a comparison with similar homes in the area
Home Values in the Area
Average Home Value in this Area
Purchase History
| Date | Buyer | Sale Price | Title Company |
|---|---|---|---|
| Grady Jonathan P | -- | Fidelity National Title Co | |
| Grady Jonathan P | $365,000 | Fidelity National Title Co | |
| Kay F Rogers 2008 Revocable Trust | -- | None Available |
Source: Public Records
Mortgage History
| Date | Status | Borrower | Loan Amount |
|---|---|---|---|
| Open | Grady Jonathan P | $292,000 |
Source: Public Records
Tax History Compared to Growth
Tax History
| Year | Tax Paid | Tax Assessment Tax Assessment Total Assessment is a certain percentage of the fair market value that is determined by local assessors to be the total taxable value of land and additions on the property. | Land | Improvement |
|---|---|---|---|---|
| 2025 | $4,953 | $438,666 | $174,263 | $264,403 |
| 2024 | $4,953 | $430,066 | $170,847 | $259,219 |
| 2023 | $4,953 | $421,635 | $167,498 | $254,137 |
| 2022 | $4,674 | $413,368 | $164,214 | $249,154 |
| 2021 | $4,615 | $405,264 | $160,995 | $244,269 |
| 2020 | $4,493 | $401,110 | $159,345 | $241,765 |
| 2019 | $4,439 | $393,246 | $156,221 | $237,025 |
| 2018 | $4,400 | $385,536 | $153,158 | $232,378 |
| 2017 | $4,307 | $377,977 | $150,155 | $227,822 |
| 2016 | $4,274 | $370,566 | $147,211 | $223,355 |
| 2015 | $4,143 | $365,000 | $145,000 | $220,000 |
| 2014 | $2,672 | $247,156 | $88,268 | $158,888 |
Source: Public Records
Map
Nearby Homes