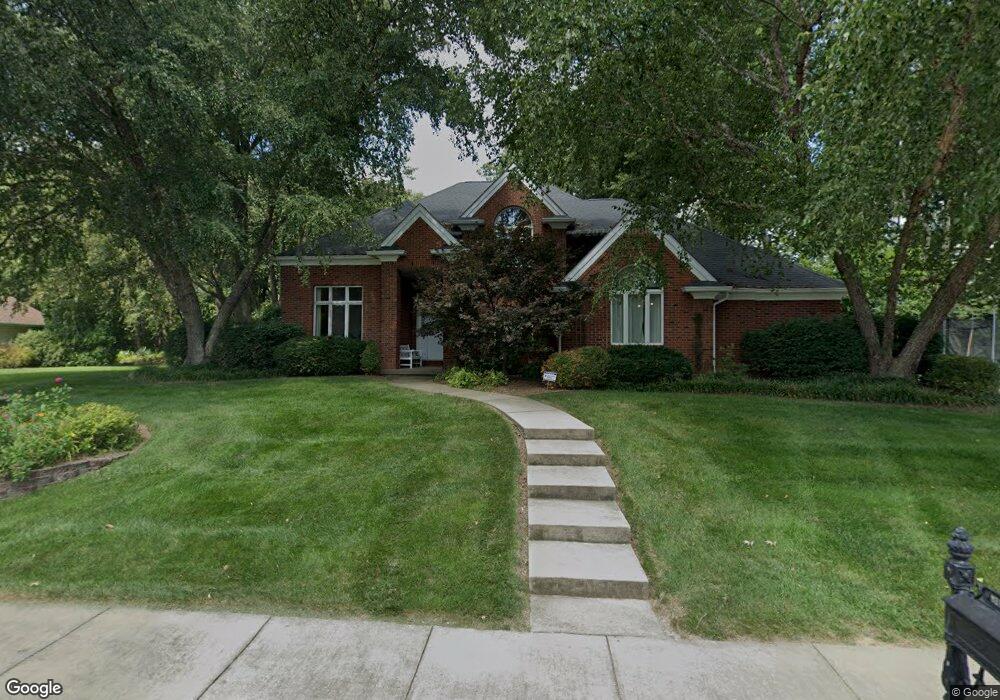
9 Hunters Point O Fallon, IL 62269
Estimated Value: $468,000 - $572,000
Studio
--
Bath
1,771
Sq Ft
$305/Sq Ft
Est. Value
About This Home
This home is located at 9 Hunters Point, O Fallon, IL 62269 and is currently estimated at $539,344, approximately $304 per square foot. 9 Hunters Point is a home located in St. Clair County with nearby schools including Kampmeyer Elementary School, Carriel Junior High School, and O'Fallon Township High School.
Ownership History
Date
Name
Owned For
Owner Type
Purchase Details
Closed on
Sep 17, 2020
Sold by
Murdoch Donald G and Murdoch Donald G
Bought by
Halverstadt Mathew E
Current Estimated Value
Home Financials for this Owner
Home Financials are based on the most recent Mortgage that was taken out on this home.
Original Mortgage
$340,000
Outstanding Balance
$298,699
Interest Rate
2.37%
Mortgage Type
New Conventional
Estimated Equity
$240,645
Purchase Details
Closed on
Mar 3, 2020
Sold by
Murdoch Donald G
Bought by
Murdoch Donald G and Murdoch Martha A
Purchase Details
Closed on
Feb 19, 2003
Sold by
Murdoch Martha A
Bought by
Murdoch Donald G and Murdoch Martha A
Home Financials for this Owner
Home Financials are based on the most recent Mortgage that was taken out on this home.
Original Mortgage
$169,000
Interest Rate
6.06%
Create a Home Valuation Report for This Property
The Home Valuation Report is an in-depth analysis detailing your home's value as well as a comparison with similar homes in the area
Home Values in the Area
Average Home Value in this Area
Purchase History
| Date | Buyer | Sale Price | Title Company |
|---|---|---|---|
| Halverstadt Mathew E | $425,000 | Community Title Shiloh Llc | |
| Murdoch Donald G | -- | None Available | |
| Murdoch Donald G | -- | First County Title Co |
Source: Public Records
Mortgage History
| Date | Status | Borrower | Loan Amount |
|---|---|---|---|
| Open | Halverstadt Mathew E | $340,000 | |
| Previous Owner | Murdoch Donald G | $169,000 |
Source: Public Records
Tax History
| Year | Tax Paid | Tax Assessment Tax Assessment Total Assessment is a certain percentage of the fair market value that is determined by local assessors to be the total taxable value of land and additions on the property. | Land | Improvement |
|---|---|---|---|---|
| 2024 | $11,710 | $160,644 | $31,110 | $129,534 |
| 2023 | $9,969 | $142,580 | $27,612 | $114,968 |
| 2022 | $9,359 | $131,084 | $25,386 | $105,698 |
| 2021 | $9,148 | $126,225 | $25,466 | $100,759 |
| 2020 | $9,068 | $119,483 | $24,106 | $95,377 |
| 2019 | $8,842 | $119,483 | $24,106 | $95,377 |
| 2018 | $8,590 | $116,014 | $23,406 | $92,608 |
| 2017 | $3,934 | $103,293 | $28,572 | $74,721 |
| 2016 | $7,808 | $100,882 | $27,905 | $72,977 |
| 2014 | $3,600 | $99,715 | $27,582 | $72,133 |
| 2013 | $8,545 | $101,292 | $27,159 | $74,133 |
Source: Public Records
Map
Nearby Homes
- 809 E Deer Creek Rd
- 518 Deer Creek Rd
- 1104 N Smiley St
- 905 Thornbury Place
- 109 Sherryl Ct
- 909 Coreopsis Ct
- 708 N Smiley St
- 1676 Lancaster Dr
- 904 MacEs Grove Rd
- 1338 Piasa Ct
- 109 Callaway Ct
- 0 Glen Hollow Dr
- 1229 Elisabeth Dr
- 166 Berringer Dr
- 1251 Wayne Ct
- 104 W Jackson St
- 1145 Illini Dr
- 323 Dennison Dr
- 307 E Washington St
- 401 N Cherry St
- 9 Hunters Point
- 5 Hunters Point
- 14 Hunters Point
- 6 Hunters Point
- 801 Deer Creek Rd
- 757 Deer Creek Rd
- 6 Hunters Pointe
- 805 Deer Creek Rd
- 1 Hunters Point
- 753 Deer Creek Rd
- 809 Deer Creek Rd
- 2 Hunters Point
- 1014 Red Fox Trail
- 10 Hunters Point
- 10 Hunters Pointe Pass
- 813 E Deer Creek Rd
- 813 Deer Creek Rd
- 5 Lorien Ct
- 1 Lorien Ct
- 817 Deer Creek Rd
Your Personal Tour Guide
Ask me questions while you tour the home.