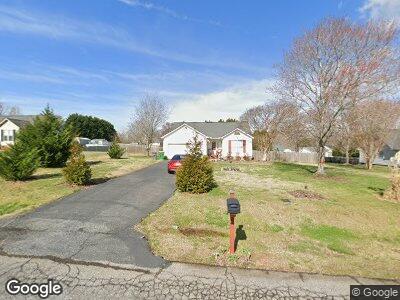
9 Idle Ln Fountain Inn, SC 29644
Estimated Value: $240,136 - $293,000
3
Beds
2
Baths
1,268
Sq Ft
$216/Sq Ft
Est. Value
About This Home
This home is located at 9 Idle Ln, Fountain Inn, SC 29644 and is currently estimated at $273,534, approximately $215 per square foot. 9 Idle Ln is a home located in Greenville County with nearby schools including Bryson Elementary School, Ralph Chandler Middle, and Woodmont High School.
Ownership History
Date
Name
Owned For
Owner Type
Purchase Details
Closed on
Jul 20, 2015
Sold by
The United States Department Of Housing
Bought by
Andrea Joseph D
Current Estimated Value
Home Financials for this Owner
Home Financials are based on the most recent Mortgage that was taken out on this home.
Original Mortgage
$89,540
Interest Rate
4.25%
Mortgage Type
FHA
Purchase Details
Closed on
Feb 13, 2015
Sold by
Selene Finance Lp
Bought by
The Secretary Of Housing & Urban Develop
Purchase Details
Closed on
Jan 21, 2015
Sold by
Kjar Danna R
Bought by
Selene Finance Lp
Purchase Details
Closed on
Jul 21, 2008
Sold by
Campbell Kyle and Campbell Kristina
Bought by
Kjar Danna R
Home Financials for this Owner
Home Financials are based on the most recent Mortgage that was taken out on this home.
Original Mortgage
$121,640
Interest Rate
5.96%
Mortgage Type
FHA
Purchase Details
Closed on
Aug 6, 2004
Sold by
Harrison Brian P
Bought by
Campbell Kristina
Create a Home Valuation Report for This Property
The Home Valuation Report is an in-depth analysis detailing your home's value as well as a comparison with similar homes in the area
Home Values in the Area
Average Home Value in this Area
Purchase History
| Date | Buyer | Sale Price | Title Company |
|---|---|---|---|
| Andrea Joseph D | $110,000 | -- | |
| The Secretary Of Housing & Urban Develop | -- | -- | |
| Selene Finance Lp | $80,000 | -- | |
| Kjar Danna R | $122,000 | -- | |
| Campbell Kristina | $102,000 | -- |
Source: Public Records
Mortgage History
| Date | Status | Borrower | Loan Amount |
|---|---|---|---|
| Open | Andrea Joseph D | $117,775 | |
| Closed | Andrea Joseph D | $89,540 | |
| Previous Owner | Kjar Danna R | $121,640 | |
| Previous Owner | Campbell Kristina | $20,000 |
Source: Public Records
Tax History Compared to Growth
Tax History
| Year | Tax Paid | Tax Assessment Tax Assessment Total Assessment is a certain percentage of the fair market value that is determined by local assessors to be the total taxable value of land and additions on the property. | Land | Improvement |
|---|---|---|---|---|
| 2024 | $831 | $5,050 | $1,120 | $3,930 |
| 2023 | $831 | $5,050 | $1,120 | $3,930 |
| 2022 | $808 | $5,050 | $1,120 | $3,930 |
| 2021 | $780 | $5,050 | $1,120 | $3,930 |
| 2020 | $773 | $4,680 | $960 | $3,720 |
| 2019 | $773 | $4,680 | $960 | $3,720 |
| 2018 | $771 | $4,680 | $960 | $3,720 |
| 2017 | $771 | $4,680 | $960 | $3,720 |
| 2016 | $678 | $117,020 | $24,000 | $93,020 |
| 2015 | $653 | $117,020 | $24,000 | $93,020 |
| 2014 | $2,031 | $125,955 | $21,643 | $104,312 |
Source: Public Records
Map
Nearby Homes
- 6 Cool Meadow Way
- 1805 Fairview Rd
- 813 Elgon Walk Dr
- 0 Peden Rd Unit 1552853
- 120 Thomason View Rd
- 00 Treaty Point Dr Unit 10
- 108 Allison Dr
- 307 Forked Oak Way
- 107 Tramore Ln
- 22 Rabon Valley Acres Rd
- 717 Nash Mill Rd
- 10 Clyde Rd
- 20 Clyde Rd
- 102 Rabon Chase Ct
- 346 Terry Rd
- 325B Hillside Church Rd
- 320 Terry Rd
- 208 Quercus Run
- 191 Wasson Way
- 314 Tall Pines Rd