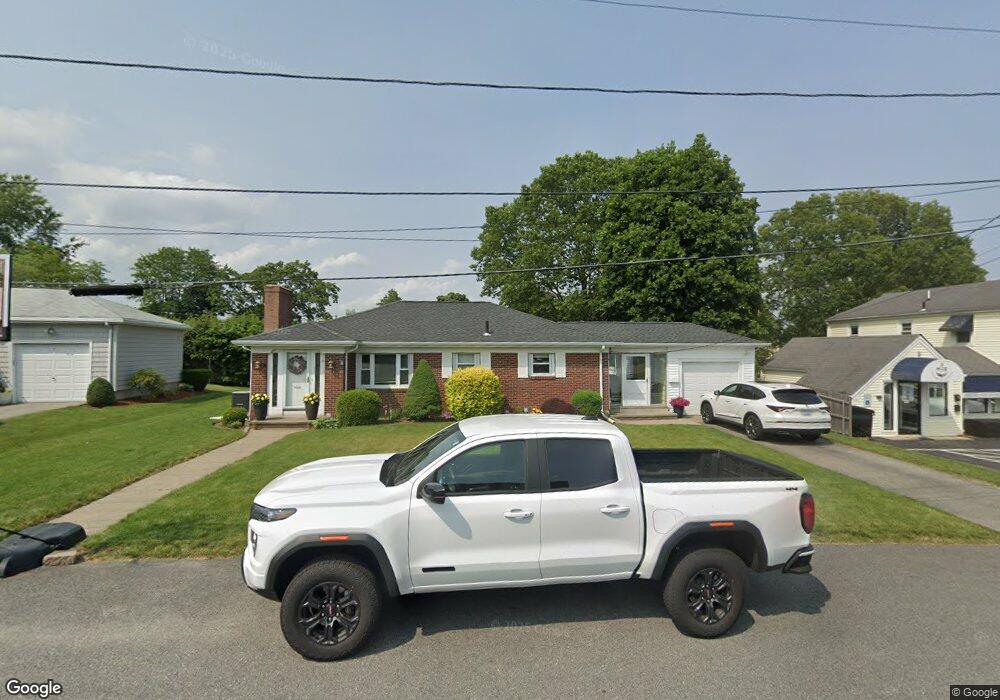
9 Jackson Rd Cranston, RI 02920
Meshanticut NeighborhoodEstimated Value: $382,583 - $451,000
2
Beds
1
Bath
1,080
Sq Ft
$386/Sq Ft
Est. Value
About This Home
This home is located at 9 Jackson Rd, Cranston, RI 02920 and is currently estimated at $416,646, approximately $385 per square foot. 9 Jackson Rd is a home located in Providence County with nearby schools including Woodridge Elementary School, Western Hills Middle School, and Cranston High School West.
Ownership History
Date
Name
Owned For
Owner Type
Purchase Details
Closed on
Nov 3, 2003
Sold by
Est Peters Lena and Brooks Robert
Bought by
Brooks Robert
Current Estimated Value
Home Financials for this Owner
Home Financials are based on the most recent Mortgage that was taken out on this home.
Original Mortgage
$140,000
Outstanding Balance
$62,526
Interest Rate
6.05%
Estimated Equity
$354,120
Create a Home Valuation Report for This Property
The Home Valuation Report is an in-depth analysis detailing your home's value as well as a comparison with similar homes in the area
Home Values in the Area
Average Home Value in this Area
Purchase History
| Date | Buyer | Sale Price | Title Company |
|---|---|---|---|
| Brooks Robert | $175,000 | -- |
Source: Public Records
Mortgage History
| Date | Status | Borrower | Loan Amount |
|---|---|---|---|
| Open | Brooks Robert | $140,000 | |
| Previous Owner | Brooks Robert | $102,600 |
Source: Public Records
Tax History
| Year | Tax Paid | Tax Assessment Tax Assessment Total Assessment is a certain percentage of the fair market value that is determined by local assessors to be the total taxable value of land and additions on the property. | Land | Improvement |
|---|---|---|---|---|
| 2025 | $4,389 | $316,200 | $107,400 | $208,800 |
| 2024 | $4,303 | $316,200 | $107,400 | $208,800 |
| 2023 | $4,122 | $218,100 | $74,100 | $144,000 |
| 2022 | $4,037 | $218,100 | $74,100 | $144,000 |
| 2021 | $3,926 | $218,100 | $74,100 | $144,000 |
| 2020 | $3,884 | $187,000 | $77,600 | $109,400 |
| 2019 | $3,884 | $187,000 | $77,600 | $109,400 |
| 2018 | $3,646 | $179,700 | $77,600 | $102,100 |
| 2017 | $3,693 | $161,000 | $70,600 | $90,400 |
| 2016 | $3,614 | $161,000 | $70,600 | $90,400 |
| 2015 | $3,614 | $161,000 | $70,600 | $90,400 |
| 2014 | $3,558 | $155,800 | $70,600 | $85,200 |
Source: Public Records
Map
Nearby Homes
- 29 Poppy Dr
- 141 Glen Ridge Rd
- 57 Delway Rd
- 242 Brettonwoods Dr
- 38 Baldino Dr
- 84 Intervale Rd
- 24 Elm Cir
- 58 Meredith Dr
- 321 Budlong Rd
- 214 Meshanticut Valley Pkwy
- 55 Cypress Dr
- 47 Bretton Woods Dr
- 275 Meshanticut Valley Pkwy
- 19 Salem Ave
- 80 W View Ave
- 135 Meshanticut Valley Pkwy
- 51 E Bel Air Rd
- 99 Salem Ave
- 129 Vallette St
- 175 Hoffman Ave Unit 102
- 15 Jackson Rd
- 1221 Reservoir Ave
- 14 Coulters Rd
- 20 Coulters Rd
- 1215 Reservoir Ave
- 21 Jackson Rd
- 26 Coulters Rd
- 32 Coulters Rd
- 27 Jackson Rd
- 15 Coulters Rd
- 7 Coulters Rd
- 19 Coulters Rd
- 38 Coulters Rd
- 27 Coulters Rd
- 1199 Reservoir Ave
- 33 Jackson Rd
- 33 Coulters Rd
- 42 Coulters Rd
- 16 Rangeley Rd
- 11 Lawnacre Dr
Your Personal Tour Guide
Ask me questions while you tour the home.