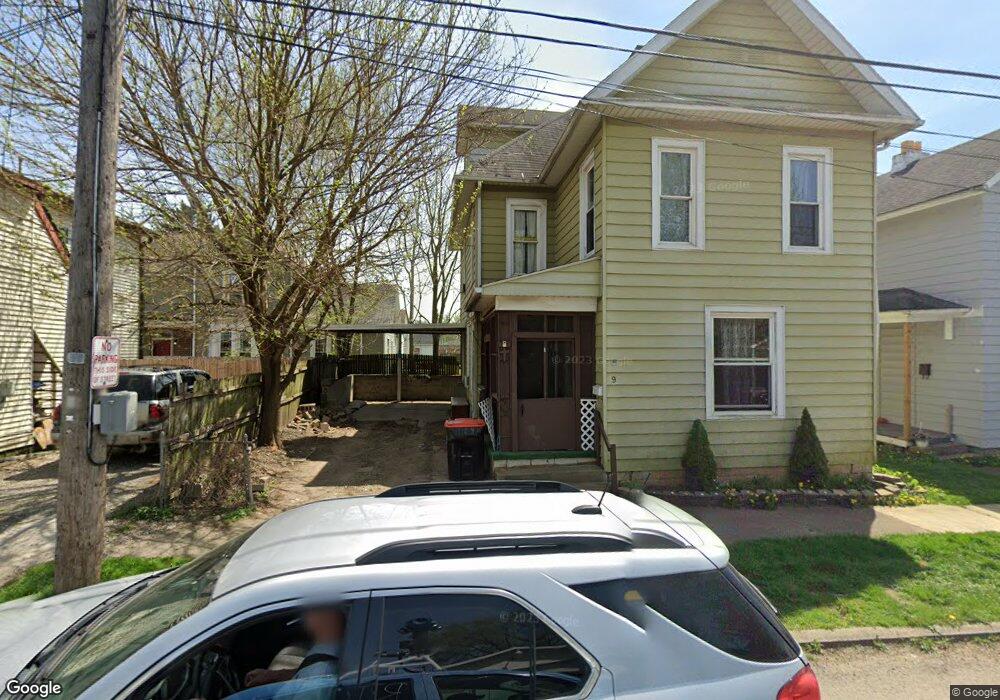
9 Jefferson St Newark, OH 43055
Estimated Value: $120,179 - $172,000
3
Beds
1
Bath
--
Sq Ft
1,742
Sq Ft Lot
About This Home
This home is located at 9 Jefferson St, Newark, OH 43055 and is currently estimated at $145,545. 9 Jefferson St is a home located in Licking County with nearby schools including Ben Franklin Elementary School, Wilson Middle School, and Newark High School.
Ownership History
Date
Name
Owned For
Owner Type
Purchase Details
Closed on
Aug 27, 2019
Sold by
Halper And Frantz Properties Llc
Bought by
9 Jefferson Newark Llc
Current Estimated Value
Purchase Details
Closed on
Aug 8, 2006
Sold by
Robideau Nancy A and Robideau Richard
Bought by
Canyon Enterprises Inc
Home Financials for this Owner
Home Financials are based on the most recent Mortgage that was taken out on this home.
Original Mortgage
$40,500
Interest Rate
6.85%
Mortgage Type
Unknown
Purchase Details
Closed on
Oct 11, 2001
Sold by
Collins Naomi L
Bought by
Robideau Nancy A and Robideau Richard
Home Financials for this Owner
Home Financials are based on the most recent Mortgage that was taken out on this home.
Original Mortgage
$48,242
Interest Rate
6.99%
Mortgage Type
FHA
Create a Home Valuation Report for This Property
The Home Valuation Report is an in-depth analysis detailing your home's value as well as a comparison with similar homes in the area
Home Values in the Area
Average Home Value in this Area
Purchase History
| Date | Buyer | Sale Price | Title Company |
|---|---|---|---|
| 9 Jefferson Newark Llc | -- | None Available | |
| Canyon Enterprises Inc | $45,000 | Kent Tit | |
| Robideau Nancy A | $49,000 | -- |
Source: Public Records
Mortgage History
| Date | Status | Borrower | Loan Amount |
|---|---|---|---|
| Previous Owner | Canyon Enterprises Inc | $40,500 | |
| Previous Owner | Robideau Nancy A | $48,242 |
Source: Public Records
Tax History Compared to Growth
Tax History
| Year | Tax Paid | Tax Assessment Tax Assessment Total Assessment is a certain percentage of the fair market value that is determined by local assessors to be the total taxable value of land and additions on the property. | Land | Improvement |
|---|---|---|---|---|
| 2024 | $1,040 | $28,320 | $2,910 | $25,410 |
| 2023 | $1,509 | $28,320 | $2,910 | $25,410 |
| 2022 | $823 | $19,920 | $1,510 | $18,410 |
| 2021 | $863 | $19,920 | $1,510 | $18,410 |
| 2020 | $882 | $19,920 | $1,510 | $18,410 |
| 2019 | $764 | $16,590 | $1,260 | $15,330 |
| 2018 | $765 | $0 | $0 | $0 |
| 2017 | $366 | $0 | $0 | $0 |
| 2016 | $827 | $0 | $0 | $0 |
| 2015 | $3 | $0 | $0 | $0 |
| 2014 | $526 | $0 | $0 | $0 |
| 2013 | $7,059 | $0 | $0 | $0 |
Source: Public Records
Map
Nearby Homes