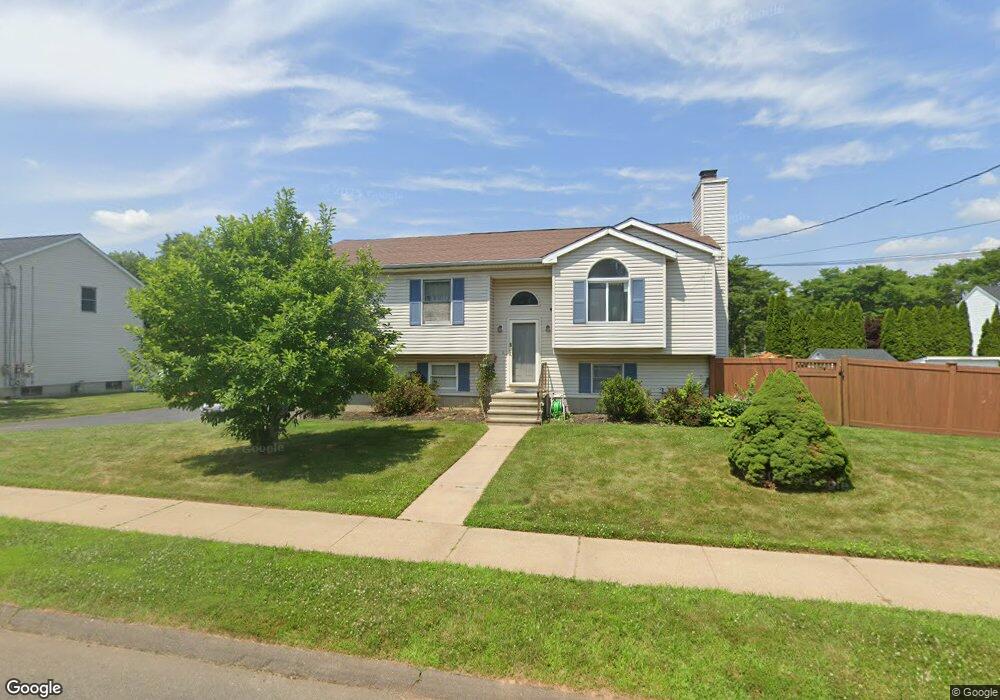
9 Joseph Ln Hamden, CT 06514
Estimated Value: $373,000 - $416,000
3
Beds
3
Baths
1,230
Sq Ft
$321/Sq Ft
Est. Value
About This Home
This home is located at 9 Joseph Ln, Hamden, CT 06514 and is currently estimated at $395,147, approximately $321 per square foot. 9 Joseph Ln is a home located in New Haven County with nearby schools including Dunbar Hill School, Hamden Middle School, and Hamden High School.
Ownership History
Date
Name
Owned For
Owner Type
Purchase Details
Closed on
Sep 22, 2009
Sold by
Coleman Irma
Bought by
Coleman-Edwards Myra
Current Estimated Value
Purchase Details
Closed on
Sep 25, 1996
Sold by
New Haven Sb
Bought by
Edwards Myra Coleman and Coleman Irma
Home Financials for this Owner
Home Financials are based on the most recent Mortgage that was taken out on this home.
Original Mortgage
$133,200
Interest Rate
7.83%
Mortgage Type
Unknown
Create a Home Valuation Report for This Property
The Home Valuation Report is an in-depth analysis detailing your home's value as well as a comparison with similar homes in the area
Home Values in the Area
Average Home Value in this Area
Purchase History
| Date | Buyer | Sale Price | Title Company |
|---|---|---|---|
| Coleman-Edwards Myra | -- | -- | |
| Edwards Myra Coleman | $134,500 | -- |
Source: Public Records
Mortgage History
| Date | Status | Borrower | Loan Amount |
|---|---|---|---|
| Closed | Edwards Myra Coleman | $80,000 | |
| Previous Owner | Edwards Myra Coleman | $55,000 | |
| Previous Owner | Edwards Myra Coleman | $35,000 | |
| Previous Owner | Edwards Myra Coleman | $133,200 |
Source: Public Records
Tax History
| Year | Tax Paid | Tax Assessment Tax Assessment Total Assessment is a certain percentage of the fair market value that is determined by local assessors to be the total taxable value of land and additions on the property. | Land | Improvement |
|---|---|---|---|---|
| 2025 | $10,797 | $208,110 | $52,080 | $156,030 |
| 2024 | $7,470 | $134,330 | $33,180 | $101,150 |
| 2023 | $7,574 | $134,330 | $33,180 | $101,150 |
| 2022 | $7,453 | $134,330 | $33,180 | $101,150 |
| 2021 | $7,044 | $134,330 | $33,180 | $101,150 |
| 2020 | $6,742 | $129,710 | $52,500 | $77,210 |
| 2019 | $6,338 | $129,710 | $52,500 | $77,210 |
| 2018 | $6,221 | $129,710 | $52,500 | $77,210 |
| 2017 | $5,871 | $129,710 | $52,500 | $77,210 |
| 2016 | $5,884 | $129,710 | $52,500 | $77,210 |
| 2015 | $6,074 | $148,610 | $64,470 | $84,140 |
| 2014 | $5,934 | $148,610 | $64,470 | $84,140 |
Source: Public Records
Map
Nearby Homes
- 50 Pleasant Dr
- 126 W Helen St
- 61 Reyna Rd
- 144 Mueller Dr
- 160 Wilmot Rd
- 2 Village Cir Unit 2
- 125 Pearl Ave
- 191 Bradley Ave
- 105 Building Brook Rd
- 80 Furman Rd
- 336 Circular Ave
- 790 Wintergreen Ave
- 45 Westview St
- 928 Wintergreen Ave
- 33 Westview St
- 89 Glenbrook Ave
- 280 Lane St
- 33 Bank St
- 105 Ursini Dr
- 61 Victoria Ct
Your Personal Tour Guide
Ask me questions while you tour the home.