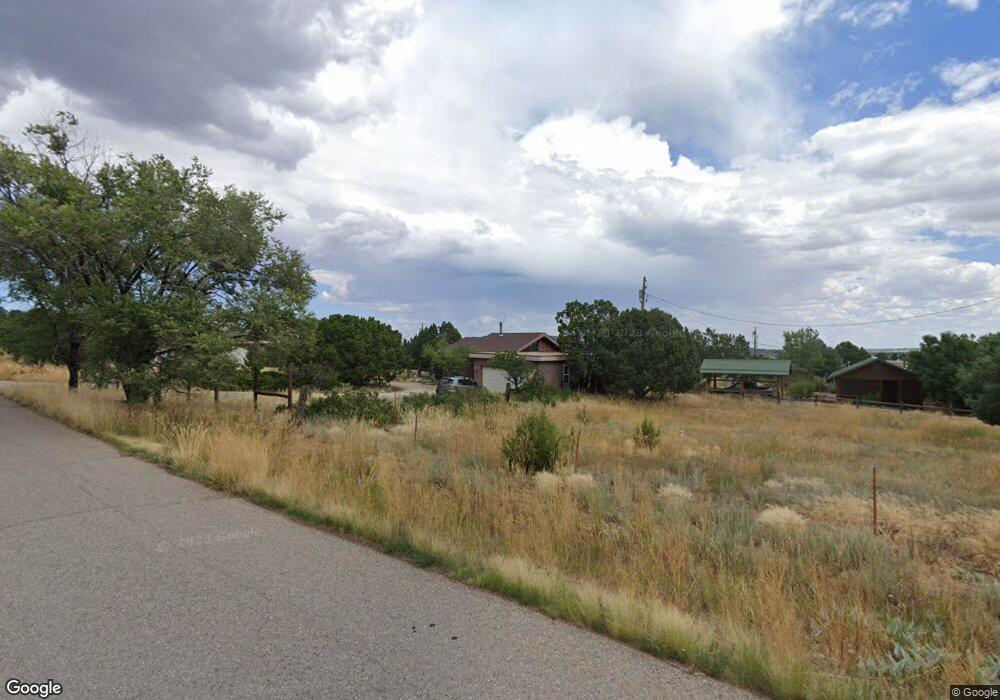
9 Juniper Hill Loop Cedar Crest, NM 87008
San Antonito NeighborhoodEstimated Value: $290,004 - $371,000
2
Beds
2
Baths
1,280
Sq Ft
$264/Sq Ft
Est. Value
About This Home
This home is located at 9 Juniper Hill Loop, Cedar Crest, NM 87008 and is currently estimated at $338,001, approximately $264 per square foot. 9 Juniper Hill Loop is a home located in Bernalillo County with nearby schools including San Antonito Elementary School, Roosevelt Middle School, and Manzano High School.
Ownership History
Date
Name
Owned For
Owner Type
Purchase Details
Closed on
May 8, 2025
Sold by
Vigil Henrietta J and Guilmette Zachary P
Bought by
Vigil Henrietta J
Current Estimated Value
Home Financials for this Owner
Home Financials are based on the most recent Mortgage that was taken out on this home.
Original Mortgage
$60,000
Outstanding Balance
$59,390
Interest Rate
6.62%
Mortgage Type
New Conventional
Estimated Equity
$278,611
Purchase Details
Closed on
Aug 30, 2011
Sold by
Macqueen Gillian E
Bought by
Vigil Henrietta J and Guilmette Zachary P
Home Financials for this Owner
Home Financials are based on the most recent Mortgage that was taken out on this home.
Original Mortgage
$172,772
Interest Rate
4.53%
Mortgage Type
New Conventional
Purchase Details
Closed on
Nov 8, 2006
Sold by
Macqueen Gillian E
Bought by
Macqueen Gillian E and Gillian E Macqueen Living Trust
Purchase Details
Closed on
May 4, 2005
Sold by
Pound Randy W
Bought by
Macqueen Gillian E
Purchase Details
Closed on
Sep 28, 2001
Sold by
Schulke Jill Anna
Bought by
Pound Randy W
Home Financials for this Owner
Home Financials are based on the most recent Mortgage that was taken out on this home.
Original Mortgage
$113,223
Interest Rate
6.88%
Mortgage Type
FHA
Create a Home Valuation Report for This Property
The Home Valuation Report is an in-depth analysis detailing your home's value as well as a comparison with similar homes in the area
Home Values in the Area
Average Home Value in this Area
Purchase History
| Date | Buyer | Sale Price | Title Company |
|---|---|---|---|
| Vigil Henrietta J | -- | Mortgage Connect | |
| Vigil Henrietta J | -- | Old Republic National Title | |
| Macqueen Gillian E | -- | None Available | |
| Macqueen Gillian E | -- | First American Title Ins Co | |
| Pound Randy W | -- | Albuquerque Title Co |
Source: Public Records
Mortgage History
| Date | Status | Borrower | Loan Amount |
|---|---|---|---|
| Open | Vigil Henrietta J | $60,000 | |
| Previous Owner | Vigil Henrietta J | $172,772 | |
| Previous Owner | Pound Randy W | $113,223 |
Source: Public Records
Tax History
| Year | Tax Paid | Tax Assessment Tax Assessment Total Assessment is a certain percentage of the fair market value that is determined by local assessors to be the total taxable value of land and additions on the property. | Land | Improvement |
|---|---|---|---|---|
| 2025 | $1,688 | $57,712 | $11,844 | $45,868 |
| 2024 | $1,632 | $56,031 | $11,499 | $44,532 |
| 2023 | $1,605 | $54,400 | $11,165 | $43,235 |
| 2022 | $1,549 | $52,816 | $10,840 | $41,976 |
| 2021 | $1,495 | $51,278 | $10,524 | $40,754 |
| 2020 | $1,531 | $49,785 | $10,218 | $39,567 |
| 2019 | $1,486 | $48,334 | $9,920 | $38,414 |
| 2018 | $1,432 | $48,334 | $9,920 | $38,414 |
| 2017 | $1,388 | $46,928 | $9,632 | $37,296 |
| 2016 | $1,344 | $44,234 | $9,079 | $35,155 |
| 2015 | $42,946 | $42,946 | $8,815 | $34,131 |
| 2014 | $1,257 | $41,695 | $8,558 | $33,137 |
| 2013 | -- | $40,481 | $8,309 | $32,172 |
Source: Public Records
Map
Nearby Homes
- 26 Juniper Hill Loop
- 5 Sycamore Dr
- 3 Oak Place
- 88 Juniper Hill Loop
- 201 Pinon Trail
- 197 & 201 Pinon Trail
- 197 Pinon Trail
- 9 Calle de Prisa
- 0 Melcor de Canoncito Unit 1098582
- 14 Pinon Ave
- 13 Pinon Ave
- 18 Calle Del Caballo
- 31 Bilotto Dr
- 31 & 37 Bilotto Dr
- 37 Bilotto Dr
- 7 Corte de Canoncito
- 143 Sangre de Cristo
- 0 N A Unit 1099233
- 0 N 14 Hwy Unit 1096048
- 207 Calais Dr
- 17 Juniper Hill Loop
- 19 Juniper Hill Loop
- 5 Juniper Hill Loop
- 15 Juniper Hill Loop
- 8 Juniper Hill Loop
- 27 Juniper Hill Loop
- 21 Juniper Hill Loop
- 1 Juniper Hill Loop
- 4 Juniper Hill Loop
- 18 Juniper Hill Loop
- 16 Juniper Hill Loop
- 2 Juniper Hill Loop
- 14 Juniper Hill Loop
- 28 Fir Loop
- 50 54 56 Juniper Hill Loop
- 46 Juniper Hill Loop
- 29 Juniper Hill Loop
- 0 Juniper Hill Loop
- 31 Fir Loop
- 30 Fir Loop
Your Personal Tour Guide
Ask me questions while you tour the home.