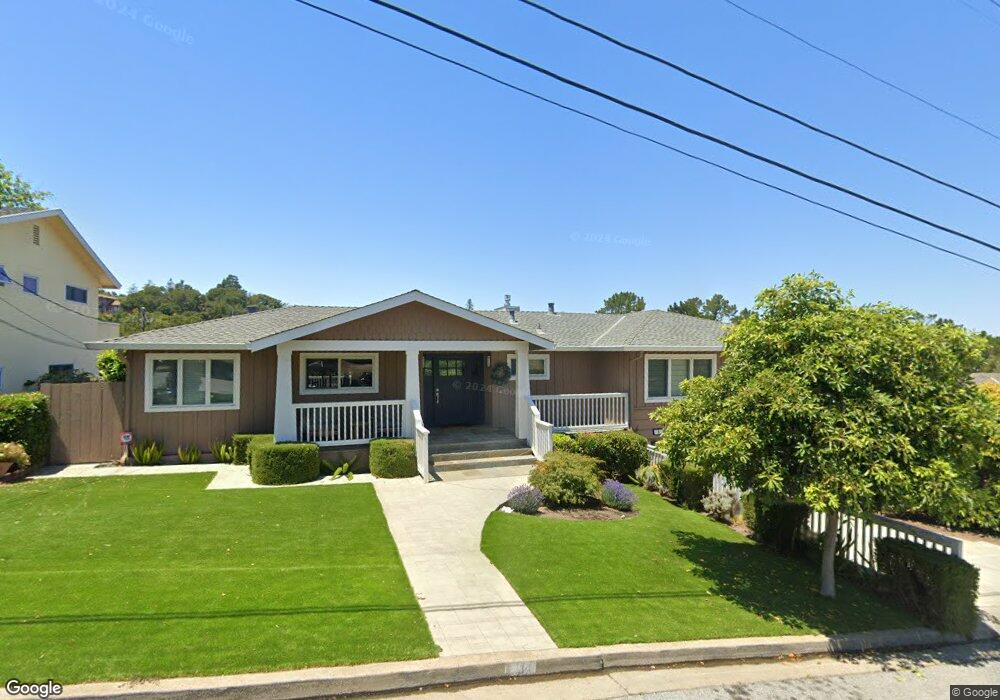
9 Kenmar Way Burlingame, CA 94010
Burlingame Hills NeighborhoodEstimated Value: $2,788,000 - $3,378,000
3
Beds
2
Baths
2,308
Sq Ft
$1,344/Sq Ft
Est. Value
About This Home
This home is located at 9 Kenmar Way, Burlingame, CA 94010 and is currently estimated at $3,103,084, approximately $1,344 per square foot. 9 Kenmar Way is a home located in San Mateo County with nearby schools including Hoover Elementary School, Burlingame Intermediate School, and Burlingame High School.
Ownership History
Date
Name
Owned For
Owner Type
Purchase Details
Closed on
Feb 22, 2013
Sold by
Platkin Cary T and Mcknew Leslie
Bought by
Mcknew Leslie and Platkin Cary T
Current Estimated Value
Home Financials for this Owner
Home Financials are based on the most recent Mortgage that was taken out on this home.
Original Mortgage
$1,249,000
Outstanding Balance
$872,716
Interest Rate
3.4%
Mortgage Type
New Conventional
Estimated Equity
$2,230,368
Purchase Details
Closed on
May 23, 2007
Sold by
Mcknew Leslie and Platkin Cary T
Bought by
Mcknew Leslie and Platkin Cary T
Purchase Details
Closed on
Jul 16, 2004
Sold by
Quist John A and Quist Tara S
Bought by
Platkin Cary T and Mcknew Leslie
Home Financials for this Owner
Home Financials are based on the most recent Mortgage that was taken out on this home.
Original Mortgage
$1,000,000
Interest Rate
5.12%
Mortgage Type
Purchase Money Mortgage
Purchase Details
Closed on
Aug 26, 2003
Sold by
Ludwigsen Lawrence R
Bought by
Quist John A and Quist Tara S
Home Financials for this Owner
Home Financials are based on the most recent Mortgage that was taken out on this home.
Original Mortgage
$633,750
Interest Rate
4.37%
Mortgage Type
Purchase Money Mortgage
Create a Home Valuation Report for This Property
The Home Valuation Report is an in-depth analysis detailing your home's value as well as a comparison with similar homes in the area
Home Values in the Area
Average Home Value in this Area
Purchase History
| Date | Buyer | Sale Price | Title Company |
|---|---|---|---|
| Mcknew Leslie | -- | Chicago Title Company | |
| Platkin Cary T | -- | Chicago Title Company | |
| Mcknew Leslie | -- | None Available | |
| Platkin Cary T | $1,250,000 | Alliance Title Company | |
| Quist John A | $845,500 | Old Republic Title Company |
Source: Public Records
Mortgage History
| Date | Status | Borrower | Loan Amount |
|---|---|---|---|
| Open | Platkin Cary T | $1,249,000 | |
| Closed | Platkin Cary T | $1,000,000 | |
| Previous Owner | Quist John A | $633,750 | |
| Closed | Platkin Cary T | $125,000 |
Source: Public Records
Tax History
| Year | Tax Paid | Tax Assessment Tax Assessment Total Assessment is a certain percentage of the fair market value that is determined by local assessors to be the total taxable value of land and additions on the property. | Land | Improvement |
|---|---|---|---|---|
| 2025 | $22,634 | $2,018,213 | $871,190 | $1,147,023 |
| 2023 | $22,634 | $1,939,845 | $837,361 | $1,102,484 |
| 2022 | $21,824 | $1,901,811 | $820,943 | $1,080,868 |
| 2021 | $21,852 | $1,864,523 | $804,847 | $1,059,676 |
| 2020 | $21,396 | $1,845,407 | $796,595 | $1,048,812 |
| 2019 | $20,921 | $1,809,224 | $780,976 | $1,028,248 |
| 2018 | $20,522 | $1,773,750 | $765,663 | $1,008,087 |
| 2017 | $20,369 | $1,738,971 | $750,650 | $988,321 |
| 2016 | $19,622 | $1,704,875 | $735,932 | $968,943 |
| 2015 | $19,533 | $1,679,267 | $724,878 | $954,389 |
| 2014 | $19,247 | $1,646,374 | $710,679 | $935,695 |
Source: Public Records
Map
Nearby Homes
- 14 Kenmar Way
- 2620 Summit Dr
- 2734 Summit Dr
- 2900 Hillside Dr
- 2260 Summit Dr
- 1408 Alvarado Ave
- 1425 Benito Ave
- 3035 Canyon Rd
- 2323 Summit Dr
- 1308 Montero Ave
- 70 Tiptoe Ln
- 6 La Strada Ct
- 85 Fagan Dr
- 90 Fagan Dr
- 2930 Privet Dr
- 2950 Churchill Dr
- 1683 Escalante Way
- 1822 Sebastian Dr
- 1208 Bernal Ave
- 1550 Frontera Way Unit 319
- 7 Kenmar Way
- 11 Kenmar Way
- 18 El Quanito Way
- 13 Kenmar Way
- 5 Kenmar Way
- 16 El Quanito Way
- 20 El Quanito Way
- 8 Kenmar Way
- 10 Kenmar Way
- 6 Kenmar Way
- 12 Kenmar Way
- 3 Kenmar Way
- 14 El Quanito Way
- 23 El Quanito Way
- 4 Kenmar Way
- 21 El Quanito Way
- 19 El Quanito Way
- 15 Kenmar Way
- 25 El Quanito Way
- 12 El Quanito Way
Your Personal Tour Guide
Ask me questions while you tour the home.