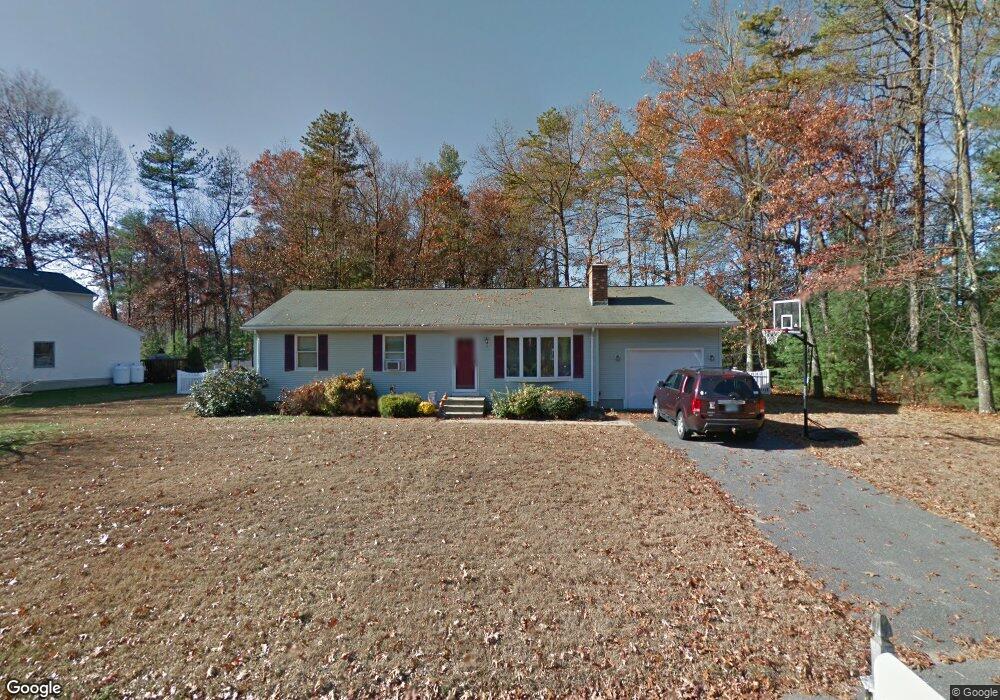
9 Kimberly Ln Easthampton, MA 01027
Estimated Value: $395,526 - $427,000
3
Beds
2
Baths
1,092
Sq Ft
$380/Sq Ft
Est. Value
About This Home
This home is located at 9 Kimberly Ln, Easthampton, MA 01027 and is currently estimated at $415,382, approximately $380 per square foot. 9 Kimberly Ln is a home located in Hampshire County with nearby schools including Easthampton High School, Calvary Baptist Christian School, and Tri-County Schools.
Ownership History
Date
Name
Owned For
Owner Type
Purchase Details
Closed on
Sep 25, 1992
Sold by
Boyle James F and Boyle Patricia
Bought by
Mottor Nancy A and Mottor David A
Current Estimated Value
Home Financials for this Owner
Home Financials are based on the most recent Mortgage that was taken out on this home.
Original Mortgage
$107,550
Interest Rate
7.9%
Mortgage Type
Purchase Money Mortgage
Create a Home Valuation Report for This Property
The Home Valuation Report is an in-depth analysis detailing your home's value as well as a comparison with similar homes in the area
Home Values in the Area
Average Home Value in this Area
Purchase History
| Date | Buyer | Sale Price | Title Company |
|---|---|---|---|
| Mottor Nancy A | $119,500 | -- |
Source: Public Records
Mortgage History
| Date | Status | Borrower | Loan Amount |
|---|---|---|---|
| Open | Mottor Nancy A | $156,000 | |
| Closed | Mottor Nancy A | $90,000 | |
| Closed | Mottor Nancy A | $30,450 | |
| Closed | Mottor Nancy A | $107,550 |
Source: Public Records
Tax History
| Year | Tax Paid | Tax Assessment Tax Assessment Total Assessment is a certain percentage of the fair market value that is determined by local assessors to be the total taxable value of land and additions on the property. | Land | Improvement |
|---|---|---|---|---|
| 2025 | $4,838 | $353,900 | $120,900 | $233,000 |
| 2024 | $4,671 | $344,500 | $117,500 | $227,000 |
| 2023 | $3,537 | $241,400 | $92,500 | $148,900 |
| 2022 | $3,990 | $241,400 | $92,500 | $148,900 |
| 2021 | $4,366 | $248,900 | $92,500 | $156,400 |
| 2020 | $4,287 | $241,400 | $92,500 | $148,900 |
| 2019 | $3,474 | $224,700 | $92,500 | $132,200 |
| 2018 | $3,328 | $208,000 | $87,200 | $120,800 |
| 2017 | $3,248 | $200,400 | $83,800 | $116,600 |
| 2016 | $3,230 | $207,200 | $83,800 | $123,400 |
| 2015 | $3,139 | $207,200 | $83,800 | $123,400 |
Source: Public Records
Map
Nearby Homes
Your Personal Tour Guide
Ask me questions while you tour the home.