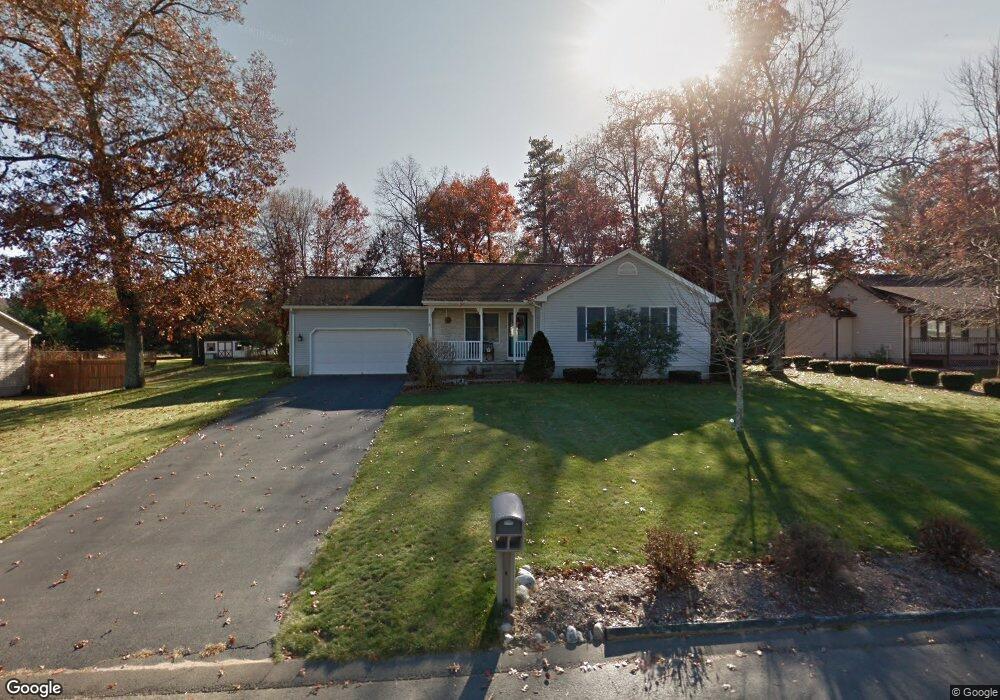
9 Laurel Dr Easthampton, MA 01027
Estimated Value: $525,615 - $579,000
3
Beds
2
Baths
1,392
Sq Ft
$391/Sq Ft
Est. Value
About This Home
This home is located at 9 Laurel Dr, Easthampton, MA 01027 and is currently estimated at $543,654, approximately $390 per square foot. 9 Laurel Dr is a home located in Hampshire County with nearby schools including Easthampton High School, Calvary Baptist Christian School, and Tri-County Schools.
Ownership History
Date
Name
Owned For
Owner Type
Purchase Details
Closed on
Sep 16, 2011
Sold by
Anglin Franklin D and Anglin Pamela S
Bought by
Moyer David J and Moyer Deborah A
Current Estimated Value
Home Financials for this Owner
Home Financials are based on the most recent Mortgage that was taken out on this home.
Original Mortgage
$160,000
Interest Rate
4.38%
Mortgage Type
Purchase Money Mortgage
Purchase Details
Closed on
Aug 16, 1996
Sold by
Lepine David M
Bought by
Anglin Franklin D and Anglin Pamela S
Create a Home Valuation Report for This Property
The Home Valuation Report is an in-depth analysis detailing your home's value as well as a comparison with similar homes in the area
Home Values in the Area
Average Home Value in this Area
Purchase History
| Date | Buyer | Sale Price | Title Company |
|---|---|---|---|
| Moyer David J | $272,500 | -- | |
| Anglin Franklin D | $135,000 | -- |
Source: Public Records
Mortgage History
| Date | Status | Borrower | Loan Amount |
|---|---|---|---|
| Closed | Moyer David J | $160,000 | |
| Previous Owner | Anglin Franklin D | $135,000 | |
| Previous Owner | Anglin Franklin D | $10,000 | |
| Previous Owner | Anglin Franklin D | $137,500 |
Source: Public Records
Tax History
| Year | Tax Paid | Tax Assessment Tax Assessment Total Assessment is a certain percentage of the fair market value that is determined by local assessors to be the total taxable value of land and additions on the property. | Land | Improvement |
|---|---|---|---|---|
| 2025 | $6,279 | $459,300 | $136,000 | $323,300 |
| 2024 | $6,061 | $447,000 | $132,000 | $315,000 |
| 2023 | $4,732 | $323,000 | $104,200 | $218,800 |
| 2022 | $5,339 | $323,000 | $104,200 | $218,800 |
| 2021 | $5,858 | $334,000 | $104,200 | $229,800 |
| 2020 | $5,736 | $323,000 | $104,200 | $218,800 |
| 2019 | $5,057 | $327,100 | $121,500 | $205,600 |
| 2018 | $4,515 | $282,200 | $114,900 | $167,300 |
| 2017 | $4,403 | $271,600 | $110,200 | $161,400 |
| 2016 | $4,234 | $271,600 | $110,200 | $161,400 |
| 2015 | $4,115 | $271,600 | $110,200 | $161,400 |
Source: Public Records
Map
Nearby Homes
- 4 Laurel Dr
- 36 & 36R Holly Cir
- 29 Sandra Rd
- 245 Park St
- 1 Plain St
- 2 W Park Dr
- 36 Line St
- 95 Gunn Rd
- 6 S St & Abutting Lots
- 41 South St Unit 11
- 48 Gunn Rd
- 38 College Hwy
- 7 Western View Rd
- 385 Main St
- 19 Mount Tom Ave Unit 19
- M143 &152 Glendale St
- 19 Nicols Way Unit 19
- 33 Knipfer Ave
- 12 Golden Cir
- 10 Golden Cir