Estimated Value: $1,707,198 - $1,987,000
3
Beds
5
Baths
5,191
Sq Ft
$349/Sq Ft
Est. Value
About This Home
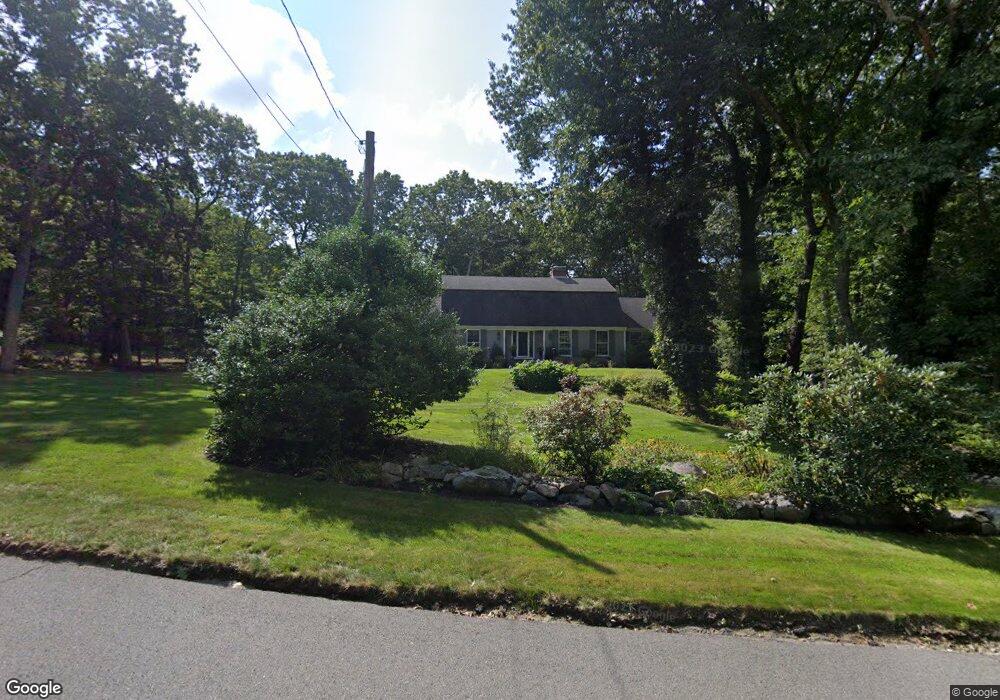
This home is located at 9 Ledgewood Dr, Dover, MA 02030 and is currently estimated at $1,810,050, approximately $348 per square foot. 9 Ledgewood Dr is a home located in Norfolk County with nearby schools including Chickering Elementary School, Dover-Sherborn Regional Middle School, and Dover-Sherborn Regional High School.
Ownership History
Date
Name
Owned For
Owner Type
Purchase Details
Closed on
Dec 22, 2021
Sold by
Fader Samuel W and Fader Mary M
Bought by
Heffernan Rene
Current Estimated Value
Purchase Details
Closed on
Mar 12, 1992
Sold by
Samii Parichehr S
Bought by
Brennan Robert T and Brennan Andrea A
Home Financials for this Owner
Home Financials are based on the most recent Mortgage that was taken out on this home.
Original Mortgage
$300,000
Interest Rate
8.64%
Mortgage Type
Purchase Money Mortgage
Create a Home Valuation Report for This Property
The Home Valuation Report is an in-depth analysis detailing your home's value as well as a comparison with similar homes in the area
Home Values in the Area
Average Home Value in this Area
Purchase History
| Date | Buyer | Sale Price | Title Company |
|---|---|---|---|
| Heffernan Rene | $1,325,000 | None Available | |
| Brennan Robert T | $335,000 | -- |
Source: Public Records
Mortgage History
| Date | Status | Borrower | Loan Amount |
|---|---|---|---|
| Previous Owner | Brennan Robert T | $310,000 | |
| Previous Owner | Brennan Robert T | $300,000 | |
| Previous Owner | Brennan Robert T | $45,000 |
Source: Public Records
Tax History
| Year | Tax Paid | Tax Assessment Tax Assessment Total Assessment is a certain percentage of the fair market value that is determined by local assessors to be the total taxable value of land and additions on the property. | Land | Improvement |
|---|---|---|---|---|
| 2025 | $15,452 | $1,371,100 | $723,100 | $648,000 |
| 2024 | $14,291 | $1,303,900 | $698,600 | $605,300 |
| 2023 | $13,773 | $1,129,900 | $612,900 | $517,000 |
| 2022 | $13,002 | $1,046,900 | $588,400 | $458,500 |
| 2021 | $13,292 | $1,031,200 | $588,400 | $442,800 |
| 2020 | $13,241 | $1,031,200 | $588,400 | $442,800 |
| 2019 | $13,333 | $1,031,200 | $588,400 | $442,800 |
| 2018 | $13,008 | $1,013,100 | $588,400 | $424,700 |
| 2017 | $12,739 | $976,200 | $539,400 | $436,800 |
| 2016 | $12,573 | $976,200 | $539,400 | $436,800 |
| 2015 | $12,055 | $949,200 | $512,400 | $436,800 |
Source: Public Records
Map
Nearby Homes
Your Personal Tour Guide
Ask me questions while you tour the home.