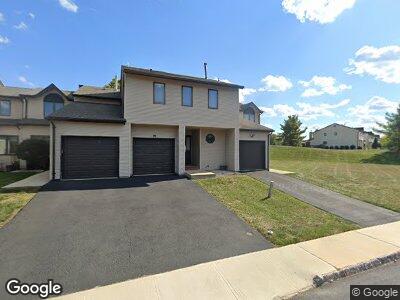
9 Linden Ct Flemington, NJ 08822
Estimated Value: $382,635 - $434,000
--
Bed
--
Bath
1,420
Sq Ft
$286/Sq Ft
Est. Value
About This Home
This home is located at 9 Linden Ct, Flemington, NJ 08822 and is currently estimated at $405,909, approximately $285 per square foot. 9 Linden Ct is a home located in Hunterdon County with nearby schools including Barley Sheaf Elementary School, J.P. Case Middle School, and Reading Fleming Intermediate School.
Ownership History
Date
Name
Owned For
Owner Type
Purchase Details
Closed on
Jan 12, 2006
Sold by
Dering Keith H and Chen Xiaoqing
Bought by
Chen Xiaoqing
Current Estimated Value
Home Financials for this Owner
Home Financials are based on the most recent Mortgage that was taken out on this home.
Original Mortgage
$140,000
Interest Rate
6.33%
Mortgage Type
Fannie Mae Freddie Mac
Purchase Details
Closed on
May 19, 2003
Sold by
Dering Keith H
Bought by
Dering Keith H and Chen Xiaoqing
Home Financials for this Owner
Home Financials are based on the most recent Mortgage that was taken out on this home.
Original Mortgage
$141,500
Interest Rate
5.83%
Mortgage Type
New Conventional
Purchase Details
Closed on
Apr 30, 2001
Sold by
Tirpak An
Bought by
Dering Keith
Home Financials for this Owner
Home Financials are based on the most recent Mortgage that was taken out on this home.
Original Mortgage
$142,500
Interest Rate
7.08%
Create a Home Valuation Report for This Property
The Home Valuation Report is an in-depth analysis detailing your home's value as well as a comparison with similar homes in the area
Home Values in the Area
Average Home Value in this Area
Purchase History
| Date | Buyer | Sale Price | Title Company |
|---|---|---|---|
| Chen Xiaoqing | $67,000 | None Available | |
| Dering Keith H | -- | -- | |
| Dering Keith | $150,000 | -- |
Source: Public Records
Mortgage History
| Date | Status | Borrower | Loan Amount |
|---|---|---|---|
| Closed | Chen Xiaoqing | $140,000 | |
| Closed | Dering Keith H | $141,500 | |
| Closed | Dering Keith | $142,500 |
Source: Public Records
Tax History Compared to Growth
Tax History
| Year | Tax Paid | Tax Assessment Tax Assessment Total Assessment is a certain percentage of the fair market value that is determined by local assessors to be the total taxable value of land and additions on the property. | Land | Improvement |
|---|---|---|---|---|
| 2024 | $6,363 | $233,600 | $110,000 | $123,600 |
| 2023 | $6,363 | $233,600 | $110,000 | $123,600 |
| 2022 | $6,202 | $233,600 | $110,000 | $123,600 |
| 2021 | $5,884 | $233,600 | $110,000 | $123,600 |
| 2020 | $6,006 | $233,600 | $110,000 | $123,600 |
| 2019 | $5,884 | $233,600 | $110,000 | $123,600 |
| 2018 | $5,812 | $233,600 | $110,000 | $123,600 |
| 2017 | $5,723 | $233,600 | $110,000 | $123,600 |
| 2016 | $5,620 | $233,600 | $110,000 | $123,600 |
| 2015 | $5,478 | $233,600 | $110,000 | $123,600 |
| 2014 | $5,406 | $233,600 | $110,000 | $123,600 |
Source: Public Records
Map
Nearby Homes
- 23 Olive Ct
- 134 Locust Ct Unit 134
- 245 Spruce Ct Unit 245
- 606 Revere Ct
- 4 Hackberry Place
- 303 Larch Ct
- 11 Pear Ct
- 14 Cedar Ct
- 7 Lake Ct
- 424 Willow Ct Unit 424
- 801 Poplar Ct
- 127 Franklin Ct
- 109 Samson Dr
- 13 Hancock Ct Unit 289
- 17 Suzanne Dr Unit 17
- 5 Witzling Ct
- 407 Saddle Ct Unit C0407
- 21 Elm Terrace
- 9 Apgar Ct
- 2 Glenn Rd