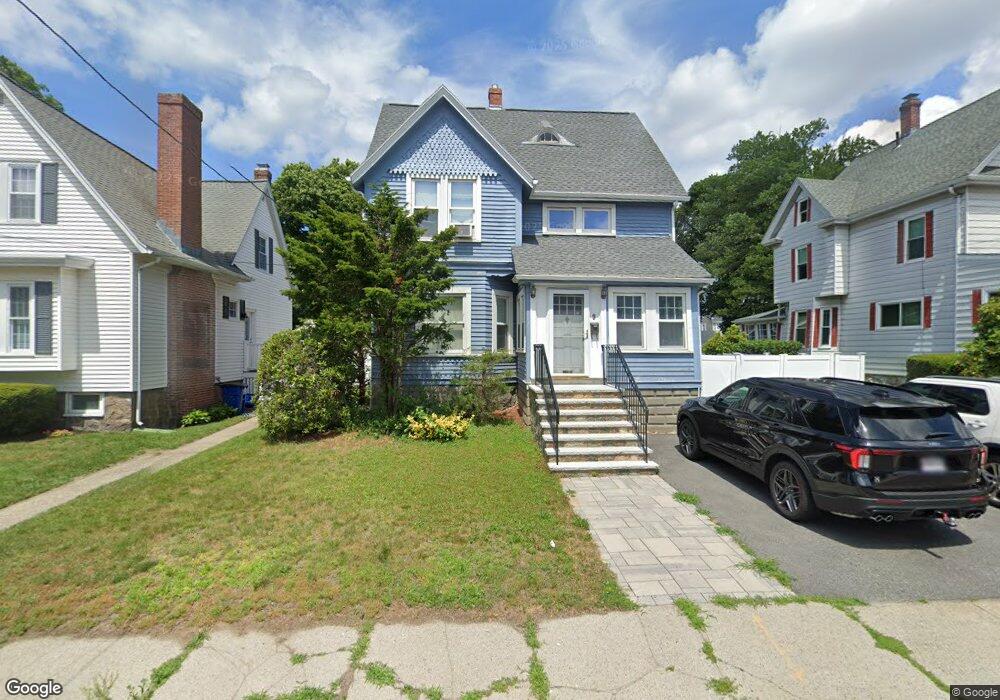
9 Linwood St Saugus, MA 01906
Cliftondale NeighborhoodEstimated Value: $662,000 - $694,000
4
Beds
2
Baths
1,973
Sq Ft
$341/Sq Ft
Est. Value
About This Home
This home is located at 9 Linwood St, Saugus, MA 01906 and is currently estimated at $673,122, approximately $341 per square foot. 9 Linwood St is a home located in Essex County with nearby schools including Saugus High School and Pioneer Charter School Of Science II.
Ownership History
Date
Name
Owned For
Owner Type
Purchase Details
Closed on
Jul 2, 2008
Sold by
Lynwood T and Pierce Mary A
Bought by
Pefine Frank A
Current Estimated Value
Purchase Details
Closed on
Aug 8, 2001
Sold by
Ciampi Maura E and Ciampi Mike
Bought by
Pierce Robert J and Pierce Mary A
Purchase Details
Closed on
May 28, 1996
Sold by
Lomas Glenn W and Lomas Cheryl
Bought by
Ciampi Mike E and Ciampi Maura
Create a Home Valuation Report for This Property
The Home Valuation Report is an in-depth analysis detailing your home's value as well as a comparison with similar homes in the area
Home Values in the Area
Average Home Value in this Area
Purchase History
| Date | Buyer | Sale Price | Title Company |
|---|---|---|---|
| Pefine Frank A | $290,000 | -- | |
| Pierce Robert J | $300,000 | -- | |
| Ciampi Mike E | $146,000 | -- |
Source: Public Records
Mortgage History
| Date | Status | Borrower | Loan Amount |
|---|---|---|---|
| Open | Ciampi Mike E | $265,300 | |
| Closed | Ciampi Mike E | $274,500 |
Source: Public Records
Tax History Compared to Growth
Tax History
| Year | Tax Paid | Tax Assessment Tax Assessment Total Assessment is a certain percentage of the fair market value that is determined by local assessors to be the total taxable value of land and additions on the property. | Land | Improvement |
|---|---|---|---|---|
| 2025 | $5,995 | $561,300 | $303,300 | $258,000 |
| 2024 | $5,755 | $540,400 | $286,000 | $254,400 |
| 2023 | $5,624 | $499,500 | $251,300 | $248,200 |
| 2022 | $5,435 | $452,500 | $230,500 | $222,000 |
| 2021 | $5,024 | $407,100 | $200,200 | $206,900 |
| 2020 | $4,650 | $390,100 | $190,700 | $199,400 |
| 2019 | $4,539 | $372,700 | $173,300 | $199,400 |
| 2018 | $4,138 | $357,300 | $168,100 | $189,200 |
| 2017 | $3,868 | $321,000 | $156,900 | $164,100 |
| 2016 | $3,527 | $289,100 | $156,600 | $132,500 |
| 2015 | $3,310 | $275,400 | $149,100 | $126,300 |
| 2014 | $3,347 | $288,300 | $149,100 | $139,200 |
Source: Public Records
Map
Nearby Homes
- 32-34 Mount Vernon St
- 32 Staaf Rd
- 28 Eustis St
- 4 Foss Ave
- 292 Salem St Unit 503
- 292 Salem St Unit 101
- 2 Ashford St
- 47 School St
- 483 Central St Unit A
- 166 Essex St
- 6 Sim Rd Unit 1
- 431 Central St
- 184 Breedens Ln
- 15 Stone St
- 7 Davis St
- 156 Salem St
- 18 Nason Rd
- 9 Oakwood Ave
- 133 Salem St Unit 418
- 133 Salem St Unit 412