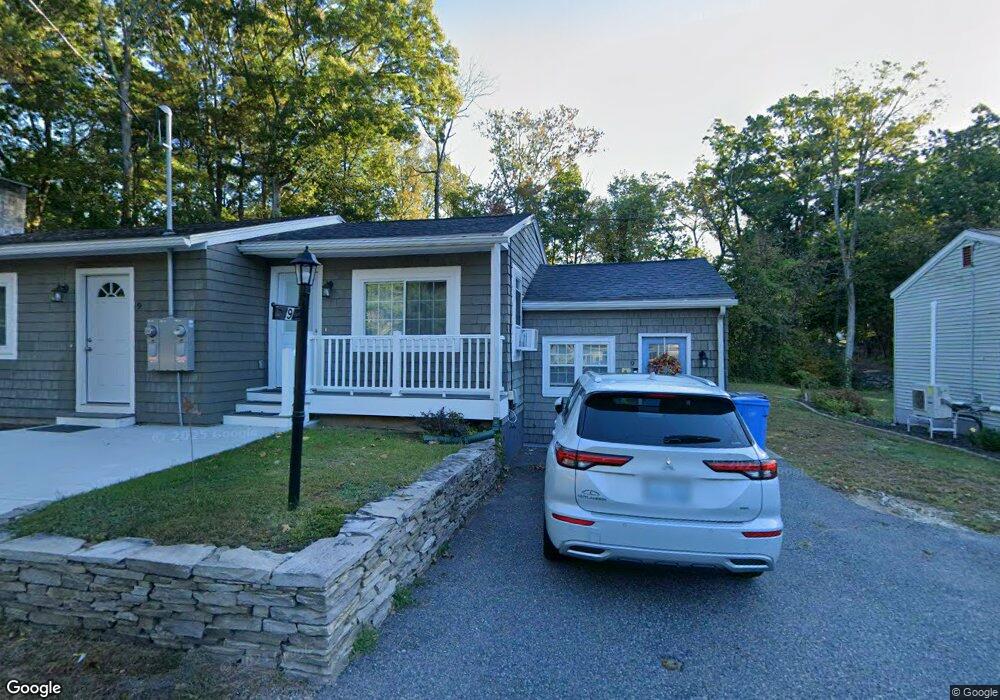
9 Lippitt Ave Cumberland, RI 02864
Ashton NeighborhoodEstimated Value: $347,000 - $451,000
3
Beds
2
Baths
1,688
Sq Ft
$247/Sq Ft
Est. Value
About This Home
This home is located at 9 Lippitt Ave, Cumberland, RI 02864 and is currently estimated at $417,387, approximately $247 per square foot. 9 Lippitt Ave is a home located in Providence County with nearby schools including Garvin Memorial School, Joseph L. McCourt Middle School, and Cumberland High School.
Ownership History
Date
Name
Owned For
Owner Type
Purchase Details
Closed on
Nov 19, 2020
Sold by
Stansfield George W
Bought by
George W Stansfield Jr Lt
Current Estimated Value
Purchase Details
Closed on
Apr 18, 2019
Sold by
Berry Reginald A and Berry Susan M
Bought by
Stansfield George W
Home Financials for this Owner
Home Financials are based on the most recent Mortgage that was taken out on this home.
Original Mortgage
$179,685
Interest Rate
4.2%
Mortgage Type
FHA
Purchase Details
Closed on
Jan 19, 1988
Bought by
Berry Reginald A and Berry Susan M
Create a Home Valuation Report for This Property
The Home Valuation Report is an in-depth analysis detailing your home's value as well as a comparison with similar homes in the area
Home Values in the Area
Average Home Value in this Area
Purchase History
| Date | Buyer | Sale Price | Title Company |
|---|---|---|---|
| George W Stansfield Jr Lt | -- | None Available | |
| Stansfield George W | $183,000 | -- | |
| Berry Reginald A | -- | -- |
Source: Public Records
Mortgage History
| Date | Status | Borrower | Loan Amount |
|---|---|---|---|
| Previous Owner | Stansfield George W | $179,685 |
Source: Public Records
Tax History Compared to Growth
Tax History
| Year | Tax Paid | Tax Assessment Tax Assessment Total Assessment is a certain percentage of the fair market value that is determined by local assessors to be the total taxable value of land and additions on the property. | Land | Improvement |
|---|---|---|---|---|
| 2025 | $3,633 | $296,100 | $87,200 | $208,900 |
| 2024 | $3,538 | $296,100 | $87,200 | $208,900 |
| 2023 | $3,441 | $296,100 | $87,200 | $208,900 |
| 2022 | $2,628 | $175,300 | $63,900 | $111,400 |
| 2021 | $2,584 | $175,300 | $63,900 | $111,400 |
| 2020 | $2,510 | $175,300 | $63,900 | $111,400 |
| 2019 | $2,795 | $176,000 | $55,200 | $120,800 |
| 2018 | $350 | $176,000 | $55,200 | $120,800 |
| 2017 | $2,677 | $176,000 | $55,200 | $120,800 |
| 2016 | $2,434 | $142,500 | $56,900 | $85,600 |
| 2015 | $2,434 | $142,500 | $56,900 | $85,600 |
| 2014 | $2,434 | $142,500 | $56,900 | $85,600 |
| 2013 | $2,588 | $164,000 | $57,600 | $106,400 |
Source: Public Records
Map
Nearby Homes
- 16 Palomino Dr
- 150 Leigh Rd
- 140 Lippitt Ave
- 45 Leigh Rd
- 27 Oxford Rd
- 30 Bear Hill Rd
- 11 Club Dr
- 160 Shirley Dr
- 164 Scott Rd
- 15 Standring St
- 73 Scott Rd
- 154 Bear Hill Rd Unit 405
- 56 Greenfield Rd
- 41&39 Indiana Ave
- 41 Indiana Ave
- 164 Bear Hill Rd Unit 24
- 1551 Diamond Hill Rd
- 66 Pequot Ave
- 1504 Hunting Hill Dr
- 1503 Hunting Hill Dr