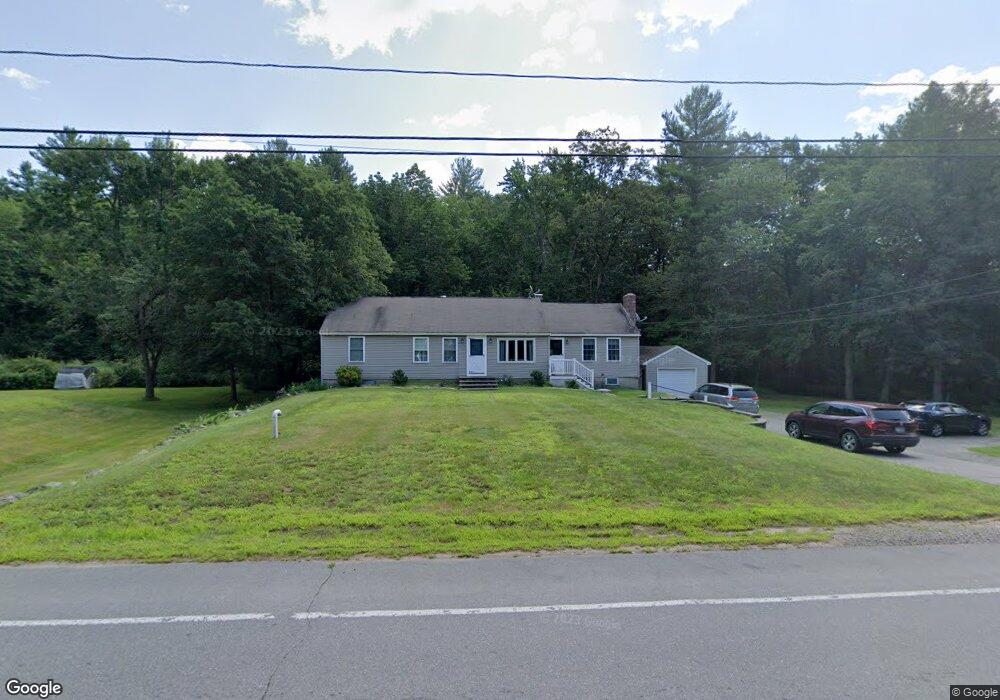
9 Lowell Rd Windham, NH 03087
Estimated Value: $558,000 - $636,000
4
Beds
2
Baths
1,431
Sq Ft
$408/Sq Ft
Est. Value
About This Home
This home is located at 9 Lowell Rd, Windham, NH 03087 and is currently estimated at $583,712, approximately $407 per square foot. 9 Lowell Rd is a home located in Rockingham County with nearby schools including Golden Brook Elementary School, Windham Middle School, and Windham High School.
Ownership History
Date
Name
Owned For
Owner Type
Purchase Details
Closed on
Nov 6, 2024
Sold by
Johnson Marie M Est and Ell
Bought by
Johnson William D and Ell Nancy
Current Estimated Value
Purchase Details
Closed on
Oct 25, 2012
Sold by
Johnson Wilfred L
Bought by
Johnson Marie M
Purchase Details
Closed on
May 14, 1985
Bought by
Johnson Marie M
Create a Home Valuation Report for This Property
The Home Valuation Report is an in-depth analysis detailing your home's value as well as a comparison with similar homes in the area
Home Values in the Area
Average Home Value in this Area
Purchase History
| Date | Buyer | Sale Price | Title Company |
|---|---|---|---|
| Johnson William D | -- | None Available | |
| Johnson William D | -- | None Available | |
| Johnson Marie M | -- | -- | |
| Johnson Marie M | -- | -- | |
| Johnson Marie M | -- | -- |
Source: Public Records
Mortgage History
| Date | Status | Borrower | Loan Amount |
|---|---|---|---|
| Previous Owner | Johnson Marie M | $149,500 |
Source: Public Records
Tax History
| Year | Tax Paid | Tax Assessment Tax Assessment Total Assessment is a certain percentage of the fair market value that is determined by local assessors to be the total taxable value of land and additions on the property. | Land | Improvement |
|---|---|---|---|---|
| 2024 | $7,213 | $318,600 | $150,000 | $168,600 |
| 2023 | $6,818 | $318,600 | $150,000 | $168,600 |
| 2022 | $6,307 | $319,200 | $150,000 | $169,200 |
| 2021 | $5,944 | $319,200 | $150,000 | $169,200 |
| 2020 | $6,106 | $319,200 | $150,000 | $169,200 |
| 2019 | $5,628 | $249,600 | $137,200 | $112,400 |
| 2018 | $5,813 | $249,600 | $137,200 | $112,400 |
| 2017 | $5,042 | $249,600 | $137,200 | $112,400 |
| 2016 | $5,446 | $249,600 | $137,200 | $112,400 |
| 2015 | $5,421 | $249,600 | $137,200 | $112,400 |
| 2014 | $5,786 | $241,100 | $163,000 | $78,100 |
| 2013 | $5,175 | $219,300 | $163,000 | $56,300 |
Source: Public Records
Map
Nearby Homes
- 4 Arbor Rd
- 16 Arbor Rd
- 98 Trails Edge Rd
- 45 Stacey Cir
- 47 Cobbetts Pond Rd
- 50 Cobbetts Pond Rd
- 210 Range Rd
- 54 Enterprise Dr
- 6 Chadwick Cir
- 18 Highclere Rd
- 14 Londonderry Rd
- 5 Johnson St
- 108 S Shore Rd
- 90 N Lowell Rd
- 39 Overton Rd
- 23 Ryan Farm Rd
- 22 Ryan Farm Rd
- 2 Mulberry St
- 20 Hancock Rd
- 106 N Lowell Rd
- 5 Lowell Rd
- 8 Lowell Rd
- 11 Lowell Rd
- 10 Lowell Rd
- 6 Lowell Rd
- 4 Lowell Rd
- 4 Lowell Rd
- 2 Collins Brook Rd
- 12 Lowell Rd
- 4 Collins Brook Rd
- 6 Pine Brook Rd
- 16 Lowell Rd
- 1 Collins Brook Rd
- 5 Pine Brook Rd
- 6 Collins Brook Rd
- 4 Pine Brook Rd
- 3 Pine Brook Rd
- 3 Collins Brook Rd
- 18 Lowell Rd
- 8 Collins Brook Rd
Your Personal Tour Guide
Ask me questions while you tour the home.