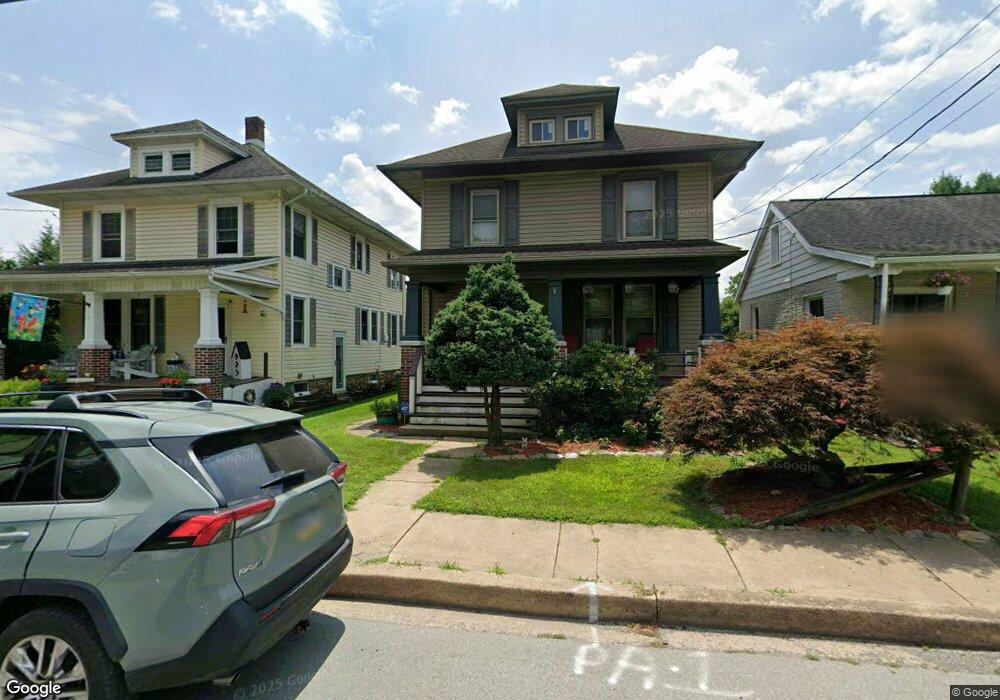
9 Main St Felton, PA 17322
Estimated Value: $213,415 - $231,000
3
Beds
2
Baths
1,318
Sq Ft
$170/Sq Ft
Est. Value
About This Home
This home is located at 9 Main St, Felton, PA 17322 and is currently estimated at $224,604, approximately $170 per square foot. 9 Main St is a home located in York County with nearby schools including North Hopewell-Winterstown Elementary School, Red Lion Area Junior High School, and Red Lion Area Senior High School.
Ownership History
Date
Name
Owned For
Owner Type
Purchase Details
Closed on
Oct 27, 2004
Sold by
Wolfe Chanse A and Wolfe Kristi A
Bought by
Krause Evan M
Current Estimated Value
Home Financials for this Owner
Home Financials are based on the most recent Mortgage that was taken out on this home.
Original Mortgage
$123,400
Outstanding Balance
$61,293
Interest Rate
5.71%
Mortgage Type
New Conventional
Estimated Equity
$163,311
Purchase Details
Closed on
Mar 28, 2000
Sold by
Witmer Eric B and Witmer Angela L
Bought by
Wolfe Chanse A and Wolfe Kristi A
Home Financials for this Owner
Home Financials are based on the most recent Mortgage that was taken out on this home.
Original Mortgage
$87,200
Interest Rate
8.4%
Purchase Details
Closed on
Jun 30, 1999
Sold by
Spanhake Debra S
Bought by
Luckenbaugh Jonathan A and Huff Timothy L
Home Financials for this Owner
Home Financials are based on the most recent Mortgage that was taken out on this home.
Original Mortgage
$104,395
Interest Rate
7.39%
Mortgage Type
FHA
Create a Home Valuation Report for This Property
The Home Valuation Report is an in-depth analysis detailing your home's value as well as a comparison with similar homes in the area
Home Values in the Area
Average Home Value in this Area
Purchase History
| Date | Buyer | Sale Price | Title Company |
|---|---|---|---|
| Krause Evan M | $129,900 | -- | |
| Wolfe Chanse A | $89,900 | -- | |
| Luckenbaugh Jonathan A | $105,000 | -- |
Source: Public Records
Mortgage History
| Date | Status | Borrower | Loan Amount |
|---|---|---|---|
| Open | Krause Evan M | $123,400 | |
| Previous Owner | Wolfe Chanse A | $87,200 | |
| Previous Owner | Luckenbaugh Jonathan A | $104,395 |
Source: Public Records
Tax History Compared to Growth
Tax History
| Year | Tax Paid | Tax Assessment Tax Assessment Total Assessment is a certain percentage of the fair market value that is determined by local assessors to be the total taxable value of land and additions on the property. | Land | Improvement |
|---|---|---|---|---|
| 2025 | $3,631 | $109,505 | $28,780 | $80,725 |
| 2024 | $3,524 | $109,505 | $28,780 | $80,725 |
| 2023 | $3,524 | $109,505 | $28,780 | $80,725 |
| 2022 | $3,524 | $109,505 | $28,780 | $80,725 |
| 2021 | $3,414 | $109,505 | $28,780 | $80,725 |
| 2020 | $3,414 | $109,505 | $28,780 | $80,725 |
| 2019 | $3,403 | $109,505 | $28,780 | $80,725 |
| 2018 | $3,403 | $109,505 | $28,780 | $80,725 |
| 2017 | $3,403 | $109,505 | $28,780 | $80,725 |
| 2016 | $0 | $109,505 | $28,780 | $80,725 |
| 2015 | -- | $109,505 | $28,780 | $80,725 |
| 2014 | -- | $109,505 | $28,780 | $80,725 |
Source: Public Records
Map
Nearby Homes
- 0 Seitz Rd
- 276 Oakbrook Dr
- 1059 Main Street Extension
- 18 Oriole Cir
- 151 Cold Stream Trail
- 290 Neff Rd
- 2733 Manor Furnace Rd
- 2727 Manor Furnace Rd
- 3005 Acorn Ln
- 11983 Tree Ln
- 12706 High Point Rd
- 1151 Delta Rd
- 335 E Snyder Corner Rd
- 209 Forest Hills Rd
- 738 Wise Ave
- 880 Springvale Rd
- 874 Delta Rd
- 645 S Main St
- 0 Oak Ridge Ave
- 0 Burkholder Rd Unit PAYK2092426