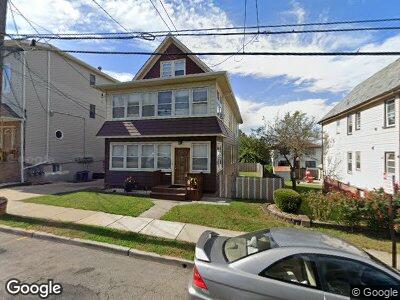
9 Main St Garfield, NJ 07026
Estimated Value: $647,750 - $855,000
--
Bed
--
Bath
2,958
Sq Ft
$256/Sq Ft
Est. Value
About This Home
This home is located at 9 Main St, Garfield, NJ 07026 and is currently estimated at $757,938, approximately $256 per square foot. 9 Main St is a home located in Bergen County with nearby schools including Garfield High School and Rainbow Montessori School - Clifton.
Ownership History
Date
Name
Owned For
Owner Type
Purchase Details
Closed on
Nov 30, 2001
Sold by
Fleischmann Doris
Bought by
Aminger Eva and Aminger Steven R
Current Estimated Value
Home Financials for this Owner
Home Financials are based on the most recent Mortgage that was taken out on this home.
Original Mortgage
$168,750
Interest Rate
7.08%
Purchase Details
Closed on
Jun 21, 1993
Sold by
Fleischmann Doris
Bought by
Fleischmann Doris
Create a Home Valuation Report for This Property
The Home Valuation Report is an in-depth analysis detailing your home's value as well as a comparison with similar homes in the area
Home Values in the Area
Average Home Value in this Area
Purchase History
| Date | Buyer | Sale Price | Title Company |
|---|---|---|---|
| Aminger Eva | $225,000 | -- | |
| Fleischmann Doris | -- | -- |
Source: Public Records
Mortgage History
| Date | Status | Borrower | Loan Amount |
|---|---|---|---|
| Open | Aminger Eva | $205,000 | |
| Previous Owner | Aminger Eva | $168,750 |
Source: Public Records
Tax History Compared to Growth
Tax History
| Year | Tax Paid | Tax Assessment Tax Assessment Total Assessment is a certain percentage of the fair market value that is determined by local assessors to be the total taxable value of land and additions on the property. | Land | Improvement |
|---|---|---|---|---|
| 2024 | $10,634 | $324,100 | $130,000 | $194,100 |
| 2023 | $10,109 | $324,100 | $130,000 | $194,100 |
| 2022 | $10,109 | $324,100 | $130,000 | $194,100 |
| 2021 | $9,814 | $324,100 | $130,000 | $194,100 |
| 2020 | $9,600 | $324,100 | $130,000 | $194,100 |
| 2019 | $9,418 | $324,100 | $130,000 | $194,100 |
| 2018 | $9,208 | $324,100 | $130,000 | $194,100 |
| 2017 | $9,046 | $324,100 | $130,000 | $194,100 |
| 2016 | $8,777 | $324,100 | $130,000 | $194,100 |
| 2015 | $8,559 | $324,100 | $130,000 | $194,100 |
| 2014 | $8,333 | $324,100 | $130,000 | $194,100 |
Source: Public Records
Map
Nearby Homes