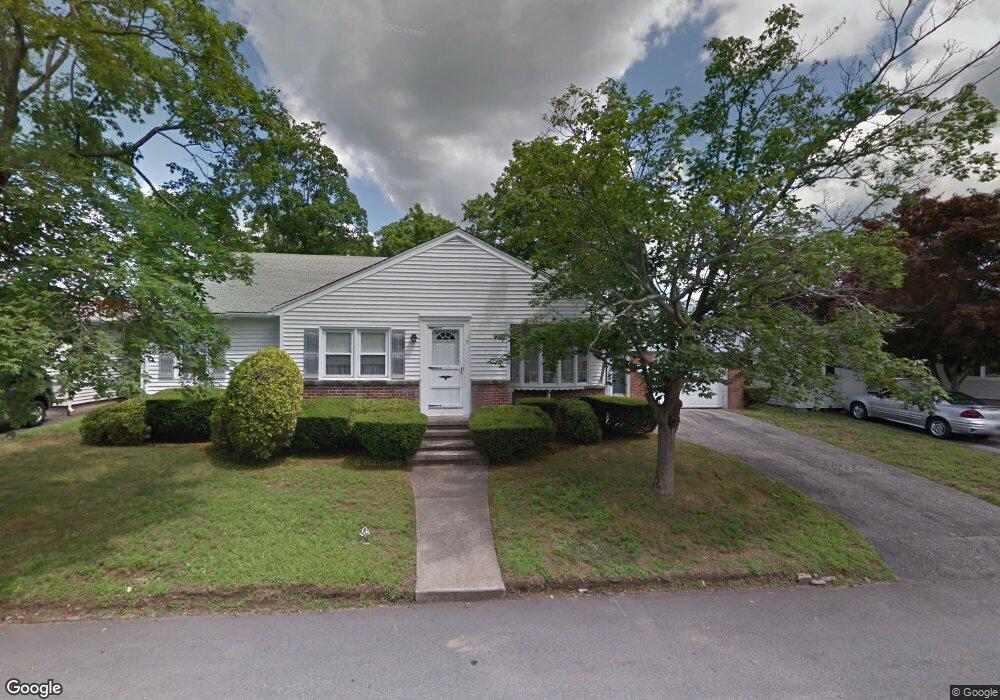
9 Manor Rd Cranston, RI 02920
Oaklawn NeighborhoodEstimated Value: $402,863 - $440,000
3
Beds
1
Bath
1,149
Sq Ft
$366/Sq Ft
Est. Value
About This Home
This home is located at 9 Manor Rd, Cranston, RI 02920 and is currently estimated at $420,466, approximately $365 per square foot. 9 Manor Rd is a home located in Providence County with nearby schools including Glen Hills School, Western Hills Middle School, and Cranston High School West.
Ownership History
Date
Name
Owned For
Owner Type
Purchase Details
Closed on
Apr 30, 2018
Sold by
9 Manor Road Llc
Bought by
Andrews Chantee M
Current Estimated Value
Home Financials for this Owner
Home Financials are based on the most recent Mortgage that was taken out on this home.
Original Mortgage
$221,906
Outstanding Balance
$192,188
Interest Rate
4.75%
Mortgage Type
FHA
Estimated Equity
$228,278
Purchase Details
Closed on
Jan 18, 2013
Sold by
Horan Virginia E
Bought by
9 Manor Rd Llc
Create a Home Valuation Report for This Property
The Home Valuation Report is an in-depth analysis detailing your home's value as well as a comparison with similar homes in the area
Home Values in the Area
Average Home Value in this Area
Purchase History
| Date | Buyer | Sale Price | Title Company |
|---|---|---|---|
| Andrews Chantee M | $226,000 | -- | |
| 9 Manor Rd Llc | $145,000 | -- |
Source: Public Records
Mortgage History
| Date | Status | Borrower | Loan Amount |
|---|---|---|---|
| Open | 9 Manor Rd Llc | $221,906 | |
| Previous Owner | 9 Manor Rd Llc | $100,000 |
Source: Public Records
Tax History
| Year | Tax Paid | Tax Assessment Tax Assessment Total Assessment is a certain percentage of the fair market value that is determined by local assessors to be the total taxable value of land and additions on the property. | Land | Improvement |
|---|---|---|---|---|
| 2025 | $4,411 | $317,800 | $103,900 | $213,900 |
| 2024 | $4,325 | $317,800 | $103,900 | $213,900 |
| 2023 | $4,305 | $227,800 | $71,700 | $156,100 |
| 2022 | $4,217 | $227,800 | $71,700 | $156,100 |
| 2021 | $4,100 | $227,800 | $71,700 | $156,100 |
| 2020 | $4,177 | $201,100 | $75,100 | $126,000 |
| 2019 | $4,177 | $201,100 | $75,100 | $126,000 |
| 2018 | $4,080 | $201,100 | $75,100 | $126,000 |
| 2017 | $4,017 | $175,100 | $68,200 | $106,900 |
| 2016 | $3,931 | $175,100 | $68,200 | $106,900 |
| 2015 | $3,931 | $175,100 | $68,200 | $106,900 |
| 2014 | $3,862 | $169,100 | $68,200 | $100,900 |
Source: Public Records
Map
Nearby Homes
- 50 Briarwood Rd
- 1027 Providence St Unit 4B
- 42 Woodland Dr
- 61 Crossland Rd
- 14 Amanda St
- 14 W Natick Rd
- 0 Natick Rd
- 12 Railroad Row
- 78 Wilbur Ave
- 46 Hornbeam Dr
- 25 Wilson St
- 52 Cottonwood Dr
- 63 Governors Hill Unit 63
- 36 Bleachery Ct
- 20 Manilla Ave
- 15 Gilcrest Dr
- 550 Wakefield St Unit 2
- 10 East St Unit 316
- 15 Carrie Ann Dr
- 9 Odonnell Ave
Your Personal Tour Guide
Ask me questions while you tour the home.