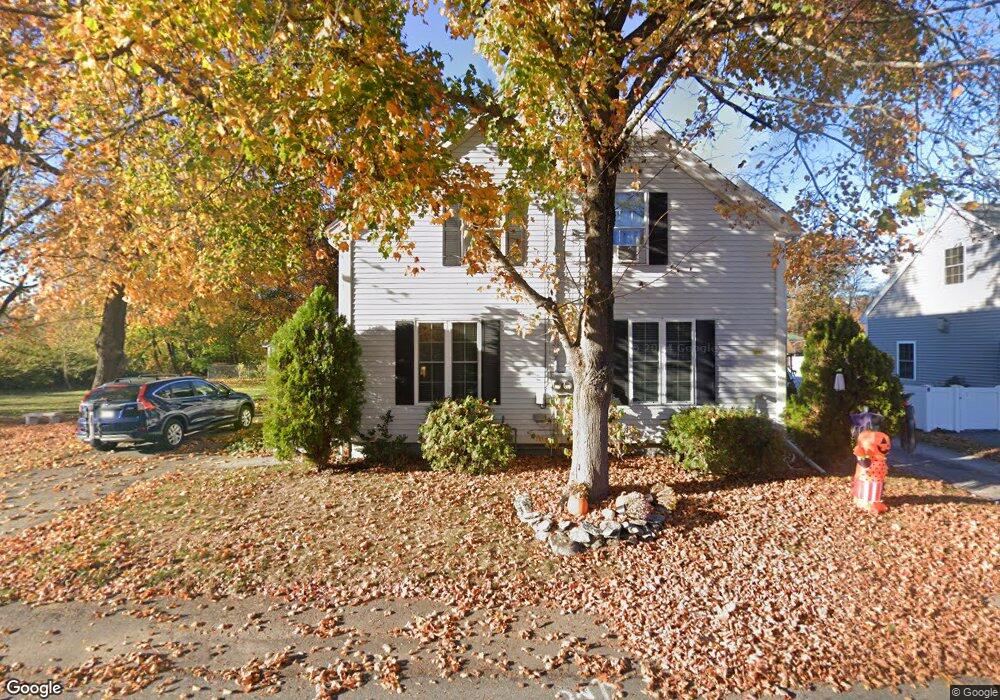
9 Maple St Merrimac, MA 01860
Estimated Value: $334,036 - $401,000
3
Beds
1
Bath
1,164
Sq Ft
$320/Sq Ft
Est. Value
About This Home
This home is located at 9 Maple St, Merrimac, MA 01860 and is currently estimated at $373,009, approximately $320 per square foot. 9 Maple St is a home located in Essex County with nearby schools including Pentucket Regional High School.
Ownership History
Date
Name
Owned For
Owner Type
Purchase Details
Closed on
Jun 16, 2011
Sold by
Lutch Michael
Bought by
Callahan Sharon
Current Estimated Value
Purchase Details
Closed on
Jun 15, 2011
Sold by
Lutch Michael and Lutch Elizabeth M
Bought by
Callahan Sharon
Purchase Details
Closed on
Apr 8, 2005
Sold by
Kazes Pamela A and Kazes Thomas A
Bought by
Lutch Michael and Lutch Elizabeth M
Create a Home Valuation Report for This Property
The Home Valuation Report is an in-depth analysis detailing your home's value as well as a comparison with similar homes in the area
Home Values in the Area
Average Home Value in this Area
Purchase History
| Date | Buyer | Sale Price | Title Company |
|---|---|---|---|
| Callahan Sharon | $168,000 | -- | |
| Callahan Sharon | $168,000 | -- | |
| Lutch Michael | $279,000 | -- |
Source: Public Records
Mortgage History
| Date | Status | Borrower | Loan Amount |
|---|---|---|---|
| Open | Lutch Michael | $130,000 | |
| Closed | Lutch Michael | $134,400 |
Source: Public Records
Tax History
| Year | Tax Paid | Tax Assessment Tax Assessment Total Assessment is a certain percentage of the fair market value that is determined by local assessors to be the total taxable value of land and additions on the property. | Land | Improvement |
|---|---|---|---|---|
| 2025 | $3,465 | $261,500 | $0 | $261,500 |
| 2024 | $3,221 | $238,600 | $0 | $238,600 |
| 2023 | $3,235 | $219,000 | $0 | $219,000 |
| 2022 | $3,268 | $200,000 | $0 | $200,000 |
| 2021 | $3,260 | $200,000 | $0 | $200,000 |
| 2020 | $2,686 | $180,500 | $0 | $180,500 |
| 2019 | $2,346 | $148,400 | $0 | $148,400 |
| 2018 | $2,339 | $148,400 | $0 | $148,400 |
| 2017 | $2,425 | $148,400 | $0 | $148,400 |
| 2016 | $2,317 | $143,400 | $0 | $143,400 |
| 2015 | $2,412 | $148,400 | $0 | $148,400 |
| 2014 | $2,358 | $148,400 | $0 | $148,400 |
Source: Public Records
Map
Nearby Homes
Your Personal Tour Guide
Ask me questions while you tour the home.