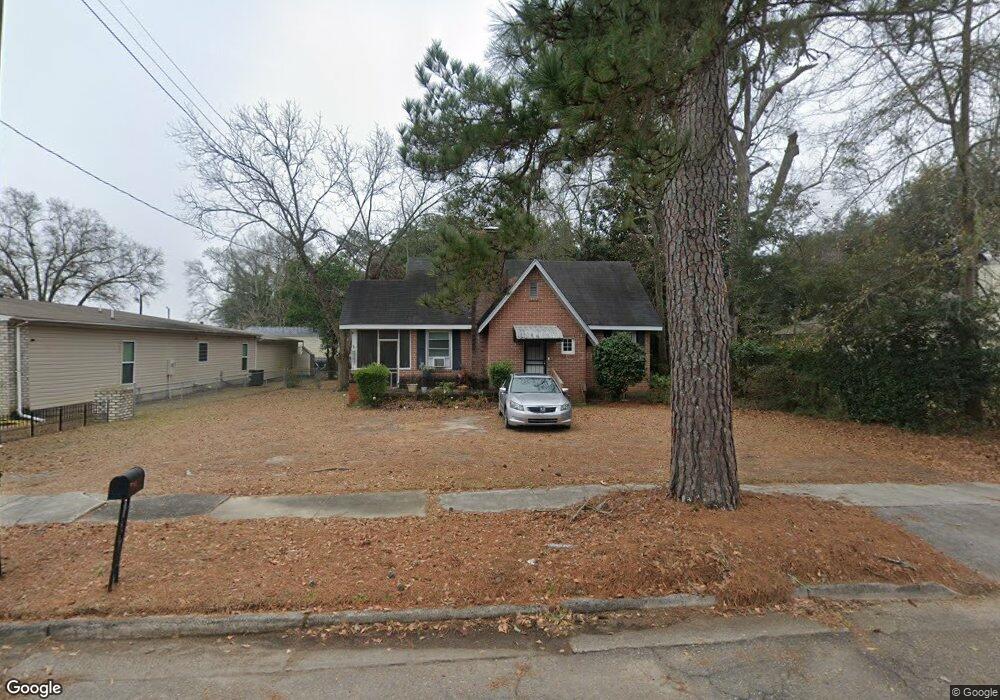
9 Marshall St Sumter, SC 29150
Hampton Park NeighborhoodEstimated Value: $111,704 - $161,000
5
Beds
2
Baths
1,964
Sq Ft
$71/Sq Ft
Est. Value
About This Home
This home is located at 9 Marshall St, Sumter, SC 29150 and is currently estimated at $139,676, approximately $71 per square foot. 9 Marshall St is a home located in Sumter County with nearby schools including Willow Drive Elementary School, Alice Drive Middle School, and Sumter High School.
Ownership History
Date
Name
Owned For
Owner Type
Purchase Details
Closed on
Oct 28, 2010
Sold by
Secretary Of Housing & Urban Development
Bought by
Durant Ivy M
Current Estimated Value
Home Financials for this Owner
Home Financials are based on the most recent Mortgage that was taken out on this home.
Original Mortgage
$76,074
Outstanding Balance
$49,549
Interest Rate
4.25%
Mortgage Type
FHA
Estimated Equity
$90,127
Purchase Details
Closed on
Dec 18, 2009
Sold by
Murdock Kelly M and Bradbery Kelly M
Bought by
Secretary Of Housing & Urban Development
Purchase Details
Closed on
Nov 1, 2007
Sold by
Hedrick Walter R
Bought by
Murdock Kelly M
Home Financials for this Owner
Home Financials are based on the most recent Mortgage that was taken out on this home.
Original Mortgage
$84,671
Interest Rate
6.37%
Mortgage Type
FHA
Purchase Details
Closed on
Apr 18, 2006
Sold by
Copeland Larry P and Copeland Janet L
Bought by
Hedrick Walter R
Create a Home Valuation Report for This Property
The Home Valuation Report is an in-depth analysis detailing your home's value as well as a comparison with similar homes in the area
Home Values in the Area
Average Home Value in this Area
Purchase History
| Date | Buyer | Sale Price | Title Company |
|---|---|---|---|
| Durant Ivy M | $69,500 | -- | |
| Secretary Of Housing & Urban Development | -- | -- | |
| Murdock Kelly M | $86,000 | Attorney | |
| Hedrick Walter R | $50,000 | None Available |
Source: Public Records
Mortgage History
| Date | Status | Borrower | Loan Amount |
|---|---|---|---|
| Open | Durant Ivy M | $76,074 | |
| Previous Owner | Murdock Kelly M | $84,671 |
Source: Public Records
Tax History
| Year | Tax Paid | Tax Assessment Tax Assessment Total Assessment is a certain percentage of the fair market value that is determined by local assessors to be the total taxable value of land and additions on the property. | Land | Improvement |
|---|---|---|---|---|
| 2025 | $1,414 | $3,640 | $910 | $2,730 |
| 2024 | $1,414 | $3,640 | $910 | $2,730 |
| 2023 | $1,414 | $3,650 | $920 | $2,730 |
| 2022 | $1,402 | $3,650 | $920 | $2,730 |
| 2021 | $1,359 | $3,650 | $920 | $2,730 |
| 2020 | $1,359 | $3,440 | $920 | $2,520 |
| 2019 | $1,352 | $3,440 | $920 | $2,520 |
| 2018 | $1,358 | $3,440 | $920 | $2,520 |
| 2017 | $1,366 | $3,440 | $920 | $2,520 |
| 2016 | $1,349 | $3,440 | $920 | $2,520 |
| 2015 | $1,453 | $3,800 | $1,220 | $2,580 |
| 2014 | $1,453 | $3,800 | $1,220 | $2,580 |
| 2013 | -- | $3,800 | $1,220 | $2,580 |
Source: Public Records
Map
Nearby Homes
- 606 N Purdy St
- 116 Mood Ave
- 6 Cumberland Way
- 112 Hasel St
- 14 Hatfield St
- 41 Radcliff Dr
- 315 N Salem Ave
- 81 Radcliff Dr
- 219 Haynsworth St
- 214 Haynsworth St
- 5 Folsom St
- 21 Highland Ave
- 135 Anderson St
- 30 Church Ct
- 249 Woodlawn Ave
- 19 Wactor St
- 761(767) N Main St
- 519 N Main St
- 22 Palmer Dr
- 15 Warren Ct
Your Personal Tour Guide
Ask me questions while you tour the home.