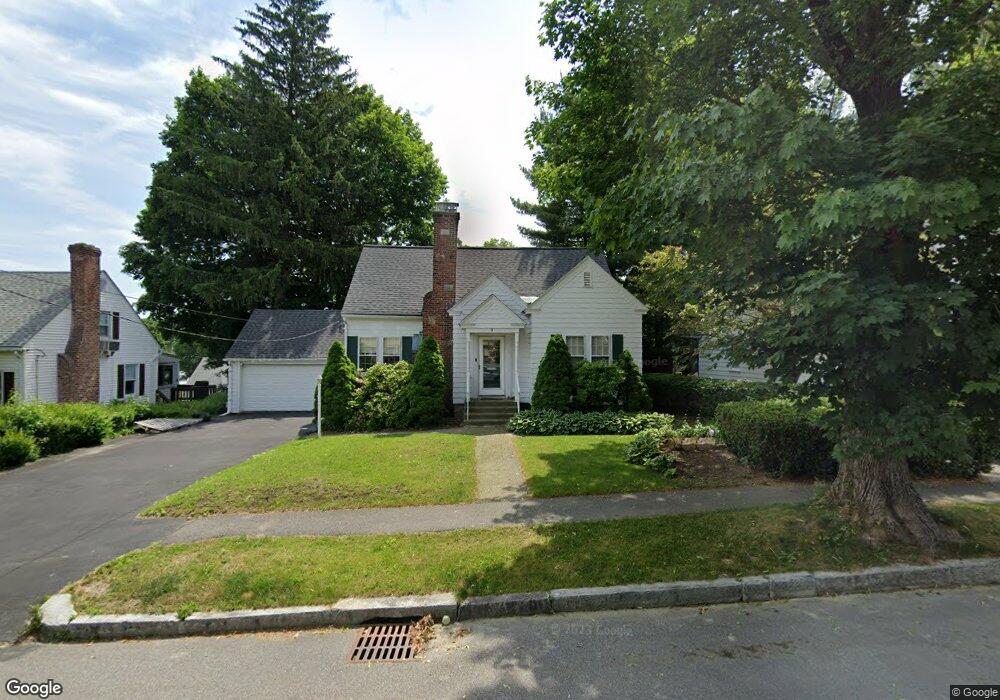
9 Maxdale Rd Worcester, MA 01602
Tatnuck NeighborhoodEstimated Value: $434,000 - $487,000
3
Beds
2
Baths
1,411
Sq Ft
$325/Sq Ft
Est. Value
About This Home
This home is located at 9 Maxdale Rd, Worcester, MA 01602 and is currently estimated at $458,447, approximately $324 per square foot. 9 Maxdale Rd is a home located in Worcester County with nearby schools including Tatnuck Magnet School, Chandler Magnet, and Jacob Hiatt Magnet School.
Ownership History
Date
Name
Owned For
Owner Type
Purchase Details
Closed on
Jun 27, 2017
Sold by
Soderblom Carl R and Soderblom Gloria M
Bought by
Dao Tu B
Current Estimated Value
Purchase Details
Closed on
Aug 31, 2009
Sold by
Sophia H Sheftel T and Cope Robert Den
Bought by
Soderblom Carl R and Soderblom Gloria M
Purchase Details
Closed on
Mar 31, 2005
Sold by
Sheftel Milton S and Sheftel Sophia H
Bought by
Sheftel-Gomes Nancy E and Dencope Robert
Create a Home Valuation Report for This Property
The Home Valuation Report is an in-depth analysis detailing your home's value as well as a comparison with similar homes in the area
Home Values in the Area
Average Home Value in this Area
Purchase History
| Date | Buyer | Sale Price | Title Company |
|---|---|---|---|
| Dao Tu B | $240,000 | -- | |
| Soderblom Carl R | $200,000 | -- | |
| Sheftel-Gomes Nancy E | -- | -- |
Source: Public Records
Tax History
| Year | Tax Paid | Tax Assessment Tax Assessment Total Assessment is a certain percentage of the fair market value that is determined by local assessors to be the total taxable value of land and additions on the property. | Land | Improvement |
|---|---|---|---|---|
| 2025 | $4,915 | $372,600 | $112,200 | $260,400 |
| 2024 | $4,815 | $350,200 | $112,200 | $238,000 |
| 2023 | $4,622 | $322,300 | $97,500 | $224,800 |
| 2022 | $4,244 | $279,000 | $78,000 | $201,000 |
| 2021 | $4,164 | $255,800 | $62,400 | $193,400 |
| 2020 | $4,055 | $238,500 | $62,400 | $176,100 |
| 2019 | $3,856 | $214,200 | $56,100 | $158,100 |
| 2018 | $3,869 | $204,600 | $56,100 | $148,500 |
| 2017 | $3,700 | $192,500 | $56,100 | $136,400 |
| 2016 | $3,673 | $178,200 | $41,700 | $136,500 |
| 2015 | $3,576 | $178,200 | $41,700 | $136,500 |
| 2014 | $3,482 | $178,200 | $41,700 | $136,500 |
Source: Public Records
Map
Nearby Homes
- 12 Cardinal Rd
- 23 Tiverton Pkwy
- 122 Copperfield Rd
- 118 Beaconsfield Rd
- 47R Yarnie Unit 3A
- 47R Yarnie Unit 1B
- 47R Yarnie Unit 2B
- 47R Yarnie Unit 4B
- 47R Yarnie Unit 8B
- 47R Yarnie Unit 5A
- 47R Yarnie Unit 6B
- 47R Yarnie Unit 4A
- 47R Yarnie Unit 1A
- 47R Yarnie Unit 9
- 47R Yarnie Unit 8A
- 47R Yarnie Unit 6A
- 47R Yarnie Unit 7A
- 47R Yarnie Unit 5B
- 47R Yarnie Unit 2A
- 47R Yarnie Unit 7B
Your Personal Tour Guide
Ask me questions while you tour the home.