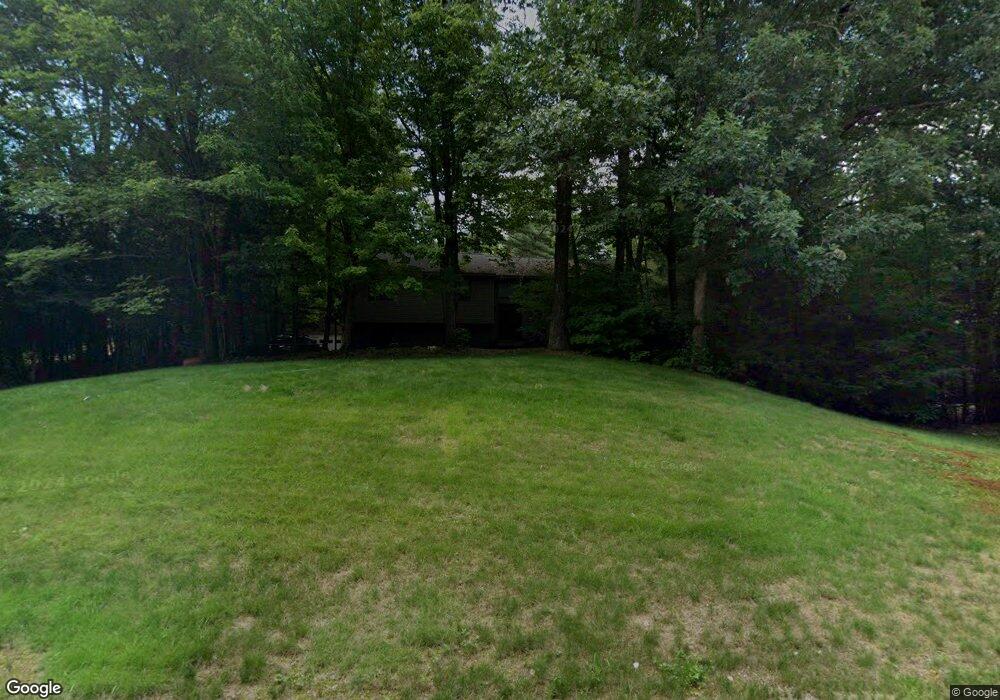
9 Meetinghouse Rd Fremont, NH 03044
Estimated Value: $463,039 - $563,000
3
Beds
2
Baths
1,352
Sq Ft
$381/Sq Ft
Est. Value
About This Home
This home is located at 9 Meetinghouse Rd, Fremont, NH 03044 and is currently estimated at $515,260, approximately $381 per square foot. 9 Meetinghouse Rd is a home located in Rockingham County with nearby schools including Ellis School.
Ownership History
Date
Name
Owned For
Owner Type
Purchase Details
Closed on
Aug 28, 2025
Sold by
Richfield Robert F
Bought by
Robert Richfield Ret and Richfield
Current Estimated Value
Purchase Details
Closed on
Sep 10, 2012
Sold by
Richfield Robert F and Richfield Stephanie
Bought by
Richfield Robert F
Home Financials for this Owner
Home Financials are based on the most recent Mortgage that was taken out on this home.
Original Mortgage
$182,666
Interest Rate
3.37%
Mortgage Type
FHA
Purchase Details
Closed on
Mar 6, 2003
Sold by
Cianciulli Veronica and Cianciulli John
Bought by
Richfield Robert F
Purchase Details
Closed on
Sep 29, 2000
Sold by
Wolf Raymond J
Bought by
Cianciulli Veronica and Cianciulli John
Purchase Details
Closed on
Apr 28, 1997
Sold by
Dunbar Charles and Dunbar Violet
Bought by
Wolf Raymond J
Create a Home Valuation Report for This Property
The Home Valuation Report is an in-depth analysis detailing your home's value as well as a comparison with similar homes in the area
Home Values in the Area
Average Home Value in this Area
Purchase History
| Date | Buyer | Sale Price | Title Company |
|---|---|---|---|
| Robert Richfield Ret | -- | -- | |
| Robert Richfield Ret | -- | -- | |
| Robert Richfield Ret | -- | -- | |
| Richfield Robert F | -- | -- | |
| Richfield Robert F | -- | -- | |
| Richfield Robert F | -- | -- | |
| Richfield Robert F | $239,900 | -- | |
| Richfield Robert F | $239,900 | -- | |
| Cianciulli Veronica | $174,900 | -- | |
| Cianciulli Veronica | $174,900 | -- | |
| Wolf Raymond J | $128,000 | -- | |
| Wolf Raymond J | $128,000 | -- |
Source: Public Records
Mortgage History
| Date | Status | Borrower | Loan Amount |
|---|---|---|---|
| Previous Owner | Richfield Robert F | $182,666 | |
| Previous Owner | Wolf Raymond J | $196,974 |
Source: Public Records
Tax History Compared to Growth
Tax History
| Year | Tax Paid | Tax Assessment Tax Assessment Total Assessment is a certain percentage of the fair market value that is determined by local assessors to be the total taxable value of land and additions on the property. | Land | Improvement |
|---|---|---|---|---|
| 2024 | $6,869 | $260,500 | $93,700 | $166,800 |
| 2023 | $6,145 | $260,500 | $93,700 | $166,800 |
| 2022 | $6,041 | $260,500 | $93,700 | $166,800 |
| 2021 | $5,964 | $267,200 | $93,700 | $173,500 |
| 2020 | $6,180 | $267,200 | $93,700 | $173,500 |
| 2019 | $38 | $229,200 | $73,500 | $155,700 |
| 2018 | $33 | $229,200 | $73,500 | $155,700 |
| 2017 | $13,985 | $229,200 | $73,500 | $155,700 |
| 2016 | $6,848 | $229,200 | $73,500 | $155,700 |
| 2015 | $6,647 | $229,200 | $73,500 | $155,700 |
| 2014 | $6,561 | $232,500 | $73,500 | $159,000 |
| 2013 | $6,629 | $232,500 | $73,500 | $159,000 |
Source: Public Records
Map
Nearby Homes
- 454 Main St
- 564 Main St
- 38 Bluefish Dr
- 94 Thunder Rd
- 308 Main St
- 54 Cavil Mill Rd
- 98 Copp Dr
- 60 Copp Dr
- 164 Hall Rd
- 240 Main St
- 45 Whittier Dr
- 188 Main St
- 8 Taylor Cir Unit 12
- Lot 7-0 Sanborn Meadow Unit 7-0
- Lot 7-3 Sanborn Meadow Unit 7-3
- Lot 7-2 Sanborn Meadow Unit 7-2
- 245 Danville Rd
- 32 Country Ln
- 118 Hall Rd Unit 3
- 9 Byrne Cir Unit 65
- 11 Meetinghouse Rd
- 3 Meetinghouse Rd
- 48 Louise Ln
- 12 Meetinghouse Rd
- 152-2-5 Gristmill Rd Unit Lot 152-2-5
- 19 Meetinghouse Rd
- 44 Louise Ln
- 47 Louise Ln
- 0 Sandown Rd Unit 2814141
- 0 Sandown Rd Unit 2804841
- 0 Sandown Rd Unit Map 1 Lot 84-1
- 69 Poplin Dr
- 55 Louise Ln
- 51 Louise Ln
- 37 Louise Ln
- 40 Louise Ln
- 61 Poplin Dr
- 55 Poplin Dr
- 70 Poplin Dr