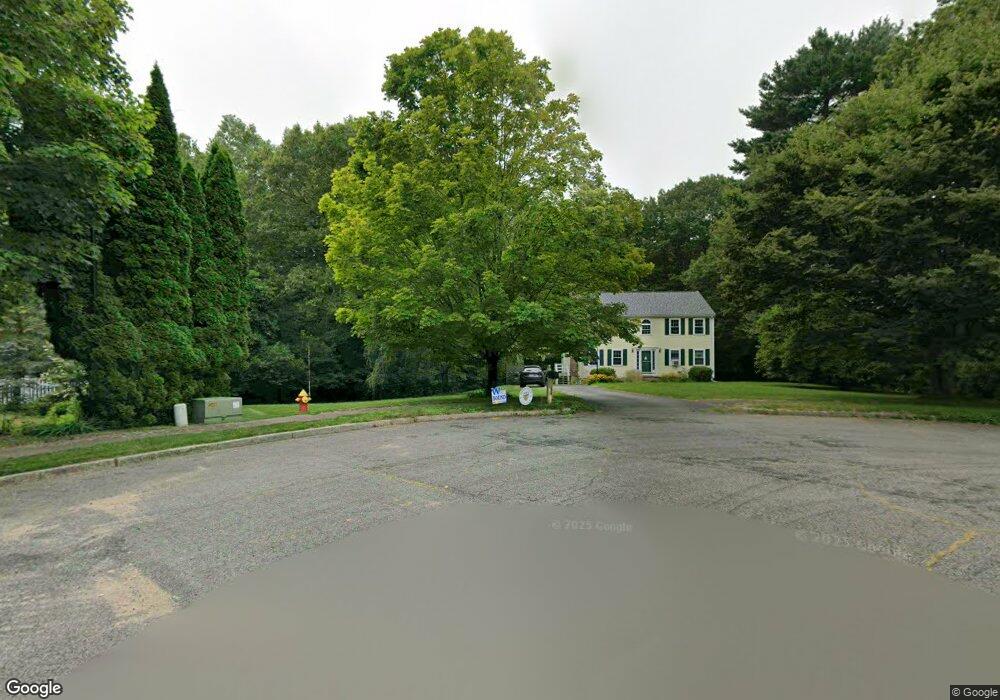
9 Megans Way Mansfield, MA 02048
Estimated Value: $701,577 - $788,000
3
Beds
2
Baths
1,893
Sq Ft
$396/Sq Ft
Est. Value
About This Home
This home is located at 9 Megans Way, Mansfield, MA 02048 and is currently estimated at $749,144, approximately $395 per square foot. 9 Megans Way is a home located in Bristol County with nearby schools including Everett W. Robinson Elementary School, Jordan/Jackson Elementary School, and Harold L. Qualters Middle School.
Ownership History
Date
Name
Owned For
Owner Type
Purchase Details
Closed on
Aug 27, 2014
Sold by
Wagner Jason and Wagner Rebecca
Bought by
Wagner Jason
Current Estimated Value
Home Financials for this Owner
Home Financials are based on the most recent Mortgage that was taken out on this home.
Original Mortgage
$294,750
Outstanding Balance
$214,356
Interest Rate
3%
Mortgage Type
Adjustable Rate Mortgage/ARM
Estimated Equity
$534,788
Purchase Details
Closed on
Oct 27, 2000
Sold by
Wilk Walter L and Wilk Allison M
Bought by
Wagner Jason and Wilk Allison M
Home Financials for this Owner
Home Financials are based on the most recent Mortgage that was taken out on this home.
Original Mortgage
$216,800
Interest Rate
7.83%
Mortgage Type
Purchase Money Mortgage
Purchase Details
Closed on
Oct 30, 1992
Sold by
East Coast Dev Ltd
Bought by
Wilk Walter L and Wilk Allison M
Home Financials for this Owner
Home Financials are based on the most recent Mortgage that was taken out on this home.
Original Mortgage
$163,000
Interest Rate
7.85%
Mortgage Type
Purchase Money Mortgage
Create a Home Valuation Report for This Property
The Home Valuation Report is an in-depth analysis detailing your home's value as well as a comparison with similar homes in the area
Home Values in the Area
Average Home Value in this Area
Purchase History
| Date | Buyer | Sale Price | Title Company |
|---|---|---|---|
| Wagner Jason | -- | -- | |
| Wagner Jason | $271,000 | -- | |
| Wilk Walter L | $171,590 | -- |
Source: Public Records
Mortgage History
| Date | Status | Borrower | Loan Amount |
|---|---|---|---|
| Open | Wagner Jason | $294,750 | |
| Previous Owner | Wilk Walter L | $215,400 | |
| Previous Owner | Wilk Walter L | $215,000 | |
| Previous Owner | Wilk Walter L | $216,800 | |
| Previous Owner | Wilk Walter L | $163,000 |
Source: Public Records
Tax History
| Year | Tax Paid | Tax Assessment Tax Assessment Total Assessment is a certain percentage of the fair market value that is determined by local assessors to be the total taxable value of land and additions on the property. | Land | Improvement |
|---|---|---|---|---|
| 2025 | $8,151 | $618,900 | $282,800 | $336,100 |
| 2024 | $8,047 | $596,100 | $295,100 | $301,000 |
| 2023 | $7,859 | $557,800 | $295,100 | $262,700 |
| 2022 | $7,582 | $499,800 | $273,200 | $226,600 |
| 2021 | $7,219 | $470,000 | $227,700 | $242,300 |
| 2020 | $7,121 | $463,600 | $227,700 | $235,900 |
| 2019 | $6,548 | $430,200 | $189,600 | $240,600 |
| 2018 | $6,496 | $417,200 | $180,900 | $236,300 |
| 2017 | $6,091 | $405,500 | $175,800 | $229,700 |
| 2016 | $5,742 | $372,600 | $167,300 | $205,300 |
| 2015 | $5,611 | $362,000 | $167,300 | $194,700 |
Source: Public Records
Map
Nearby Homes
- 150 Gilbert St
- 14 Claire Ave
- 24 Maverick Dr
- 49 Pheasant Hill Rd
- 115 Westfield Dr
- 25 Munroe Dr
- 451R Gilbert St
- 57 Vine St
- 128 Tremont St
- 25 Shepherd St
- 2 Oak St Unit 2A
- 2 Oak St Unit 2B
- 71 Richardson Ave
- Lot 2 Jeffrey Dr
- Lot 5 Jeffrey Dr
- 84 Messenger St
- 150 John L Dietsch Blvd
- 9 Coach Rd
- 21 Shady Ln
- 17 Childs Ln
Your Personal Tour Guide
Ask me questions while you tour the home.