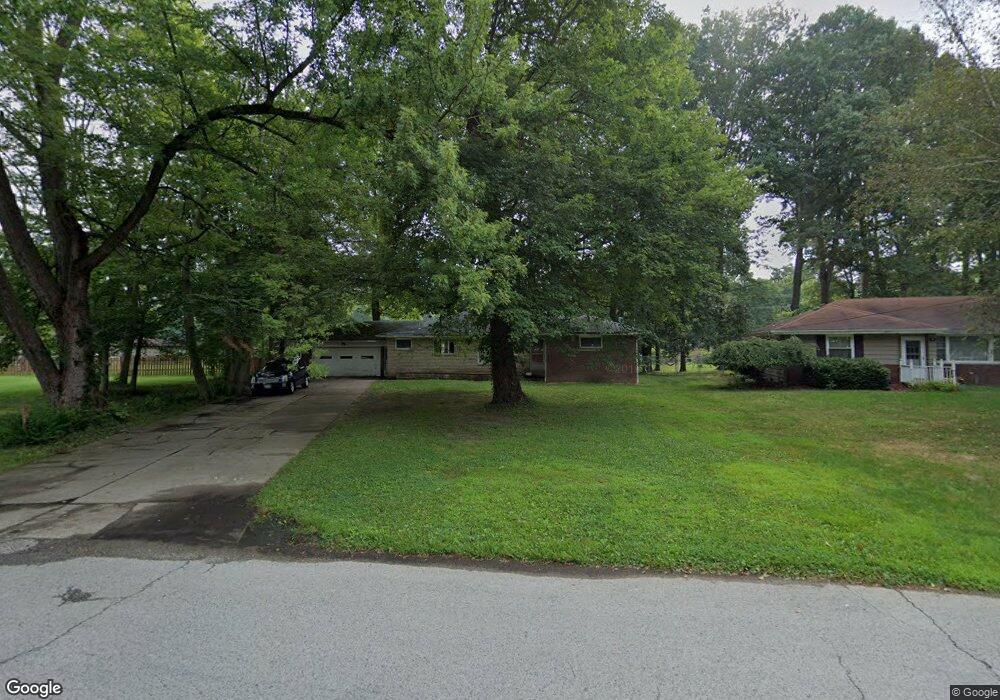
9 Mill Trace Rd Youngstown, OH 44511
Estimated Value: $207,000 - $232,000
3
Beds
2
Baths
1,992
Sq Ft
$112/Sq Ft
Est. Value
About This Home
This home is located at 9 Mill Trace Rd, Youngstown, OH 44511 and is currently estimated at $222,534, approximately $111 per square foot. 9 Mill Trace Rd is a home located in Mahoning County with nearby schools including West Boulevard Elementary School, Boardman Center Middle School, and Boardman High School.
Ownership History
Date
Name
Owned For
Owner Type
Purchase Details
Closed on
Feb 16, 2023
Sold by
Harris Kathleen A
Bought by
Harris David L
Current Estimated Value
Purchase Details
Closed on
Feb 9, 2006
Sold by
Edwards Karla
Bought by
Harris David
Home Financials for this Owner
Home Financials are based on the most recent Mortgage that was taken out on this home.
Original Mortgage
$22,380
Interest Rate
5.76%
Mortgage Type
Stand Alone Second
Purchase Details
Closed on
Feb 6, 2006
Sold by
Olson Charles Louis and Olson Marilyn
Bought by
Harris David
Home Financials for this Owner
Home Financials are based on the most recent Mortgage that was taken out on this home.
Original Mortgage
$22,380
Interest Rate
5.76%
Mortgage Type
Stand Alone Second
Purchase Details
Closed on
Sep 25, 1989
Bought by
Mortensen Renee E
Create a Home Valuation Report for This Property
The Home Valuation Report is an in-depth analysis detailing your home's value as well as a comparison with similar homes in the area
Home Values in the Area
Average Home Value in this Area
Purchase History
| Date | Buyer | Sale Price | Title Company |
|---|---|---|---|
| Harris David L | -- | None Listed On Document | |
| Harris David L | -- | None Listed On Document | |
| Harris David | -- | None Available | |
| Harris David | $111,900 | None Available | |
| Mortensen Renee E | -- | -- |
Source: Public Records
Mortgage History
| Date | Status | Borrower | Loan Amount |
|---|---|---|---|
| Previous Owner | Harris David | $22,380 | |
| Previous Owner | Harris David | $89,520 |
Source: Public Records
Tax History
| Year | Tax Paid | Tax Assessment Tax Assessment Total Assessment is a certain percentage of the fair market value that is determined by local assessors to be the total taxable value of land and additions on the property. | Land | Improvement |
|---|---|---|---|---|
| 2025 | $3,393 | $62,870 | $9,020 | $53,850 |
| 2024 | $3,653 | $62,870 | $9,020 | $53,850 |
| 2023 | $3,240 | $62,870 | $9,020 | $53,850 |
| 2022 | $3,259 | $48,410 | $7,790 | $40,620 |
| 2021 | $3,261 | $48,410 | $7,790 | $40,620 |
| 2020 | $3,277 | $48,410 | $7,790 | $40,620 |
| 2019 | $3,595 | $40,350 | $6,500 | $33,850 |
| 2018 | $2,682 | $40,350 | $6,500 | $33,850 |
| 2017 | $2,651 | $40,350 | $6,500 | $33,850 |
| 2016 | $2,833 | $42,730 | $6,500 | $36,230 |
| 2015 | $3,078 | $42,730 | $6,500 | $36,230 |
| 2014 | $2,787 | $42,730 | $6,500 | $36,230 |
| 2013 | $2,754 | $42,730 | $6,500 | $36,230 |
Source: Public Records
Map
Nearby Homes
- 57 Gillian Ln
- 21.19 acres Truesdale and Lockwood Rd
- 85 Lake Shore Dr
- 4052 Lockwood Blvd
- 4013 Hopkins Rd
- 3930 Risher Rd
- 5025 Lockwood Blvd
- 3911 Arden Blvd
- 5200 West Blvd Unit 405
- 5200 West Blvd Unit 505
- 3628 Hopkins Rd
- 1038 Zander Dr
- 3560 Arden Blvd
- 3448 Risher Rd
- 322 Shields Rd
- 3435 Hopkins Rd
- 4225 Stratford Rd
- 153 Overhill Rd
- 2002 Canfield Rd
- 244 Shields Rd
- 15 Mill Trace Rd
- 4477 Lockwood Blvd
- 4485 Lockwood Blvd
- 21 Mill Trace Rd
- 10 Mill Trace Rd
- 4 Mill Trace Rd
- 4463 Lockwood Blvd
- 16 Mill Trace Rd
- 11 Lake Shore Dr
- 15 Lake Shore Dr
- 54 Gillian Ln
- 19 Lake Shore Dr
- 46 Gillian Ln
- 22 Mill Trace Rd
- 40 Gillian Ln
- 22 Gillian Ln
- 4459 Lockwood Blvd
- 28 Mill Trace Rd
- 4480 Lockwood Blvd
- 4474 Lockwood Blvd
Your Personal Tour Guide
Ask me questions while you tour the home.