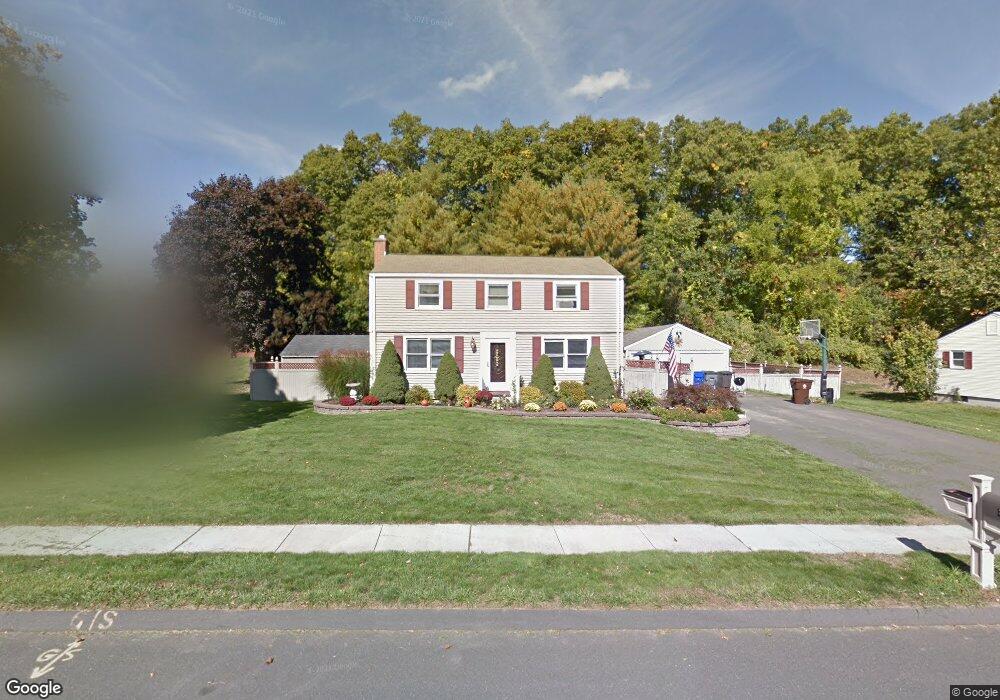
9 Monroe Rd Enfield, CT 06082
Estimated Value: $354,000 - $404,000
4
Beds
3
Baths
1,632
Sq Ft
$234/Sq Ft
Est. Value
About This Home
This home is located at 9 Monroe Rd, Enfield, CT 06082 and is currently estimated at $381,714, approximately $233 per square foot. 9 Monroe Rd is a home located in Hartford County with nearby schools including Nathan Hale Elementary School, Eli Whitney Elementary School, and Enfield High School.
Ownership History
Date
Name
Owned For
Owner Type
Purchase Details
Closed on
Sep 27, 1996
Sold by
Brooks Richard and Brooks Anniesofie
Bought by
Timpone Michael and Timpone Karen
Current Estimated Value
Purchase Details
Closed on
May 18, 1988
Sold by
Nadeau David
Bought by
Brooks Richard
Create a Home Valuation Report for This Property
The Home Valuation Report is an in-depth analysis detailing your home's value as well as a comparison with similar homes in the area
Home Values in the Area
Average Home Value in this Area
Purchase History
| Date | Buyer | Sale Price | Title Company |
|---|---|---|---|
| Timpone Michael | $124,750 | -- | |
| Brooks Richard | $164,900 | -- |
Source: Public Records
Mortgage History
| Date | Status | Borrower | Loan Amount |
|---|---|---|---|
| Open | Brooks Richard | $167,500 | |
| Closed | Brooks Richard | $50,000 | |
| Closed | Brooks Richard | $121,000 | |
| Closed | Brooks Richard | $123,100 |
Source: Public Records
Tax History
| Year | Tax Paid | Tax Assessment Tax Assessment Total Assessment is a certain percentage of the fair market value that is determined by local assessors to be the total taxable value of land and additions on the property. | Land | Improvement |
|---|---|---|---|---|
| 2025 | $6,525 | $185,900 | $64,700 | $121,200 |
| 2024 | $6,285 | $185,900 | $64,700 | $121,200 |
| 2023 | $6,188 | $184,400 | $64,700 | $119,700 |
| 2022 | $5,696 | $184,400 | $64,700 | $119,700 |
| 2021 | $5,566 | $148,150 | $55,780 | $92,370 |
| 2020 | $5,529 | $148,150 | $55,780 | $92,370 |
| 2019 | $5,522 | $148,150 | $55,780 | $92,370 |
| 2018 | $5,373 | $148,150 | $55,780 | $92,370 |
| 2017 | $5,049 | $148,150 | $55,780 | $92,370 |
| 2016 | $4,875 | $146,120 | $55,780 | $90,340 |
| 2015 | $4,726 | $146,120 | $55,780 | $90,340 |
| 2014 | $4,607 | $146,120 | $55,780 | $90,340 |
Source: Public Records
Map
Nearby Homes
Your Personal Tour Guide
Ask me questions while you tour the home.