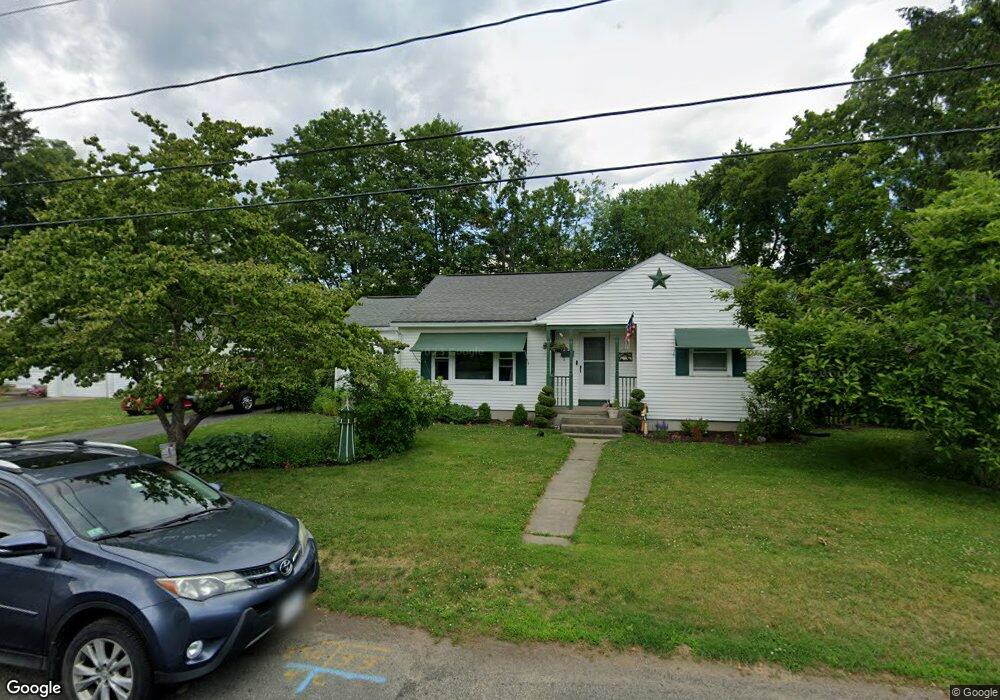
9 Mutter St Easthampton, MA 01027
Estimated Value: $288,000 - $350,513
2
Beds
2
Baths
1,040
Sq Ft
$316/Sq Ft
Est. Value
About This Home
This home is located at 9 Mutter St, Easthampton, MA 01027 and is currently estimated at $328,128, approximately $315 per square foot. 9 Mutter St is a home located in Hampshire County with nearby schools including Easthampton High School, Tri-County Schools, and New England Adolescent Research Institute.
Ownership History
Date
Name
Owned For
Owner Type
Purchase Details
Closed on
Jun 30, 1994
Sold by
Kerr Leonora G and Press Louise J
Bought by
Leveille Debbie Lee and Leveille Mark D
Current Estimated Value
Home Financials for this Owner
Home Financials are based on the most recent Mortgage that was taken out on this home.
Original Mortgage
$84,500
Interest Rate
8.55%
Mortgage Type
Purchase Money Mortgage
Create a Home Valuation Report for This Property
The Home Valuation Report is an in-depth analysis detailing your home's value as well as a comparison with similar homes in the area
Home Values in the Area
Average Home Value in this Area
Purchase History
| Date | Buyer | Sale Price | Title Company |
|---|---|---|---|
| Leveille Debbie Lee | $89,000 | -- |
Source: Public Records
Mortgage History
| Date | Status | Borrower | Loan Amount |
|---|---|---|---|
| Open | Leveille Debbie Lee | $116,450 | |
| Closed | Leveille Debbie Lee | $84,500 |
Source: Public Records
Tax History
| Year | Tax Paid | Tax Assessment Tax Assessment Total Assessment is a certain percentage of the fair market value that is determined by local assessors to be the total taxable value of land and additions on the property. | Land | Improvement |
|---|---|---|---|---|
| 2025 | $4,275 | $312,700 | $105,900 | $206,800 |
| 2024 | $4,125 | $304,200 | $102,800 | $201,400 |
| 2023 | $3,116 | $212,700 | $81,200 | $131,500 |
| 2022 | $3,516 | $212,700 | $81,200 | $131,500 |
| 2021 | $532 | $219,400 | $81,200 | $138,200 |
| 2020 | $3,778 | $212,700 | $81,200 | $131,500 |
| 2019 | $504 | $204,600 | $81,200 | $123,400 |
| 2018 | $3,027 | $189,200 | $76,500 | $112,700 |
| 2017 | $2,953 | $182,200 | $73,600 | $108,600 |
| 2016 | $2,947 | $189,000 | $73,600 | $115,400 |
| 2015 | $2,863 | $189,000 | $73,600 | $115,400 |
Source: Public Records
Map
Nearby Homes
- 4 Gaugh St
- 40 Clark St
- 2 Oak St
- 33 Knipfer Ave
- 19 Nicols Way Unit 19
- 7 Union Ct
- 12 Glen Cove Place Unit B
- 10 Glen Cove Place Unit A
- 18-20 Oakdale Place
- 29 Parsons St Unit 1
- 6 Wilton Rd
- 6 S St & Abutting Lots
- 41 South St Unit 11
- 36 & 36R Holly Cir
- 11 Dragon Cir
- 2 W Park Dr
- 336 Main St
- 385 Main St
- M143 &152 Glendale St
- 245 Park St
Your Personal Tour Guide
Ask me questions while you tour the home.