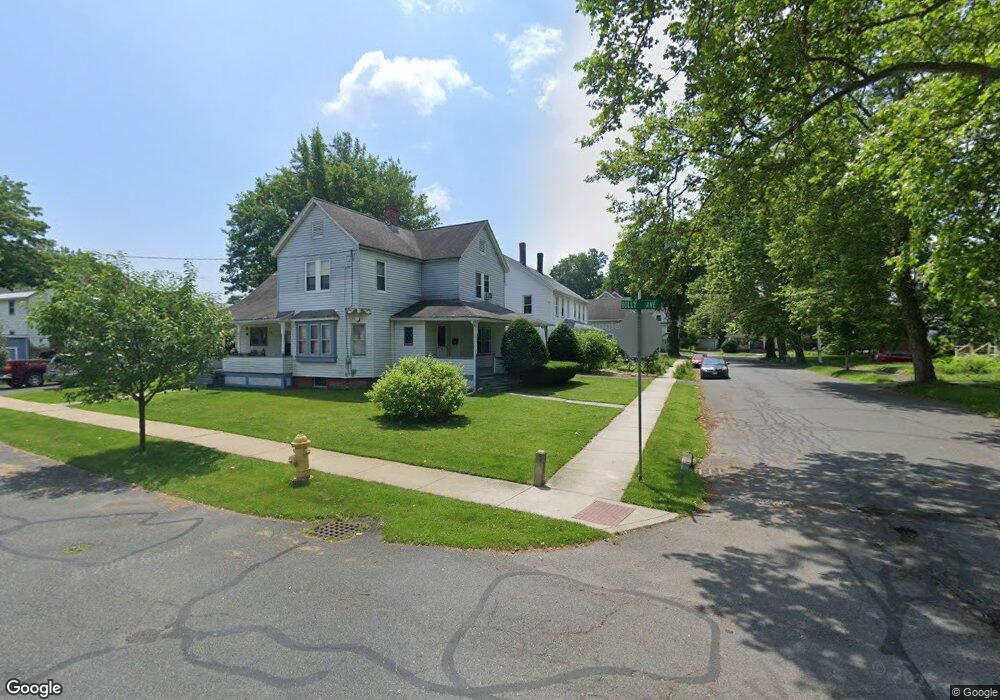
9 Myrtle St Unit 11 Greenfield, MA 01301
Estimated Value: $295,000 - $334,000
6
Beds
3
Baths
2,399
Sq Ft
$131/Sq Ft
Est. Value
About This Home
This home is located at 9 Myrtle St Unit 11, Greenfield, MA 01301 and is currently estimated at $315,304, approximately $131 per square foot. 9 Myrtle St Unit 11 is a home located in Franklin County with nearby schools including Holy Trinity School and Cornerstone Christian School.
Ownership History
Date
Name
Owned For
Owner Type
Purchase Details
Closed on
Jun 25, 2018
Sold by
Bowen 2012 Ret and Bowen
Bought by
Freedman Michael H and Katz Sara R
Current Estimated Value
Home Financials for this Owner
Home Financials are based on the most recent Mortgage that was taken out on this home.
Original Mortgage
$171,200
Outstanding Balance
$138,815
Interest Rate
4.5%
Mortgage Type
New Conventional
Estimated Equity
$176,489
Purchase Details
Closed on
Feb 15, 2012
Sold by
Bowen Kenneth B
Bought by
Bowen 2012 Ret
Purchase Details
Closed on
Dec 1, 1986
Bought by
Bowen Ret
Create a Home Valuation Report for This Property
The Home Valuation Report is an in-depth analysis detailing your home's value as well as a comparison with similar homes in the area
Home Values in the Area
Average Home Value in this Area
Purchase History
| Date | Buyer | Sale Price | Title Company |
|---|---|---|---|
| Freedman Michael H | $180,300 | -- | |
| Freedman Michael H | $180,300 | -- | |
| Bowen 2012 Ret | -- | -- | |
| Bowen 2012 Ret | -- | -- | |
| Bowen Ret | $90,000 | -- |
Source: Public Records
Mortgage History
| Date | Status | Borrower | Loan Amount |
|---|---|---|---|
| Open | Freedman Michael H | $171,200 | |
| Closed | Freedman Michael H | $171,200 |
Source: Public Records
Tax History Compared to Growth
Tax History
| Year | Tax Paid | Tax Assessment Tax Assessment Total Assessment is a certain percentage of the fair market value that is determined by local assessors to be the total taxable value of land and additions on the property. | Land | Improvement |
|---|---|---|---|---|
| 2025 | $4,557 | $233,000 | $65,600 | $167,400 |
| 2024 | $4,455 | $218,500 | $52,600 | $165,900 |
| 2023 | $4,305 | $217,800 | $52,600 | $165,200 |
| 2022 | $4,033 | $180,700 | $47,600 | $133,100 |
| 2021 | $4,189 | $180,400 | $47,300 | $133,100 |
| 2020 | $4,040 | $176,200 | $43,000 | $133,200 |
| 2019 | $3,622 | $162,000 | $37,400 | $124,600 |
| 2018 | $3,548 | $158,200 | $36,700 | $121,500 |
| 2017 | $3,438 | $158,200 | $36,700 | $121,500 |
| 2016 | $3,315 | $152,000 | $35,300 | $116,700 |
| 2015 | $3,516 | $156,200 | $39,500 | $116,700 |
| 2014 | $3,207 | $156,200 | $39,500 | $116,700 |
Source: Public Records
Map
Nearby Homes