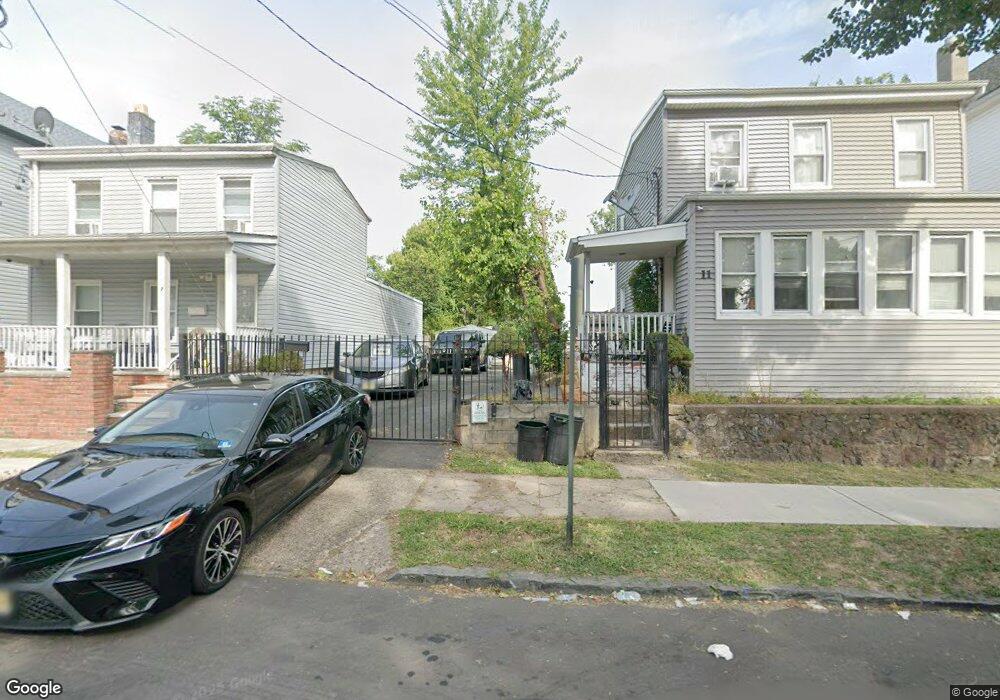
9 N 4th St Unit 11 Paterson, NJ 07522
Northside NeighborhoodEstimated Value: $458,099 - $639,000
Studio
--
Bath
1,520
Sq Ft
$347/Sq Ft
Est. Value
About This Home
This home is located at 9 N 4th St Unit 11, Paterson, NJ 07522 and is currently estimated at $527,025, approximately $346 per square foot. 9 N 4th St Unit 11 is a home located in Passaic County with nearby schools including Edward W. Kilpatrick School of Discovery, Dale Avenue Elementary School, and Dr. Frank Napier, Jr. School of Technology.
Ownership History
Date
Name
Owned For
Owner Type
Purchase Details
Closed on
Apr 8, 2011
Sold by
Lacosta Bernardo A and Ortiz Noemi
Bought by
Belfield Wakina S
Current Estimated Value
Home Financials for this Owner
Home Financials are based on the most recent Mortgage that was taken out on this home.
Original Mortgage
$82,845
Outstanding Balance
$58,988
Interest Rate
5.5%
Mortgage Type
FHA
Estimated Equity
$468,037
Create a Home Valuation Report for This Property
The Home Valuation Report is an in-depth analysis detailing your home's value as well as a comparison with similar homes in the area
Home Values in the Area
Average Home Value in this Area
Purchase History
| Date | Buyer | Sale Price | Title Company |
|---|---|---|---|
| Belfield Wakina S | $85,000 | -- |
Source: Public Records
Mortgage History
| Date | Status | Borrower | Loan Amount |
|---|---|---|---|
| Open | Belfield Wakina S | $82,845 |
Source: Public Records
Tax History
| Year | Tax Paid | Tax Assessment Tax Assessment Total Assessment is a certain percentage of the fair market value that is determined by local assessors to be the total taxable value of land and additions on the property. | Land | Improvement |
|---|---|---|---|---|
| 2025 | $6,990 | $137,200 | $43,800 | $93,400 |
| 2024 | $6,727 | $137,200 | $43,800 | $93,400 |
| 2022 | $6,369 | $137,200 | $43,800 | $93,400 |
| 2021 | $6,141 | $137,200 | $43,800 | $93,400 |
| 2020 | $5,728 | $137,200 | $43,800 | $93,400 |
| 2019 | $5,560 | $134,500 | $43,300 | $91,200 |
| 2018 | $5,745 | $132,800 | $43,000 | $89,800 |
| 2017 | $5,487 | $131,900 | $42,800 | $89,100 |
| 2016 | $6,036 | $139,100 | $45,000 | $94,100 |
| 2015 | $5,714 | $139,100 | $45,000 | $94,100 |
| 2014 | $8,300 | $286,200 | $168,800 | $117,400 |
Source: Public Records
Map
Nearby Homes
- 11 N 5th St
- 30 N 5th St Unit PT32
- 8 N 3rd St Unit 10
- 131 Temple St
- 43 Cliff St
- 54 N 4th St
- 59 N 4th St
- 54 N 3rd St Unit 56
- 18-20 N 7th St
- 33 N 7th St
- 73 N 6th St
- 116 Oxford St
- 541 Union Ave
- 223 W Broadway
- 20 N
- 116 Belmont Ave
- 123 Belmont Ave Unit 125
- 123-125 Belmont Ave
- 101 N 8th St
- 210-212 Temple St
Your Personal Tour Guide
Ask me questions while you tour the home.