
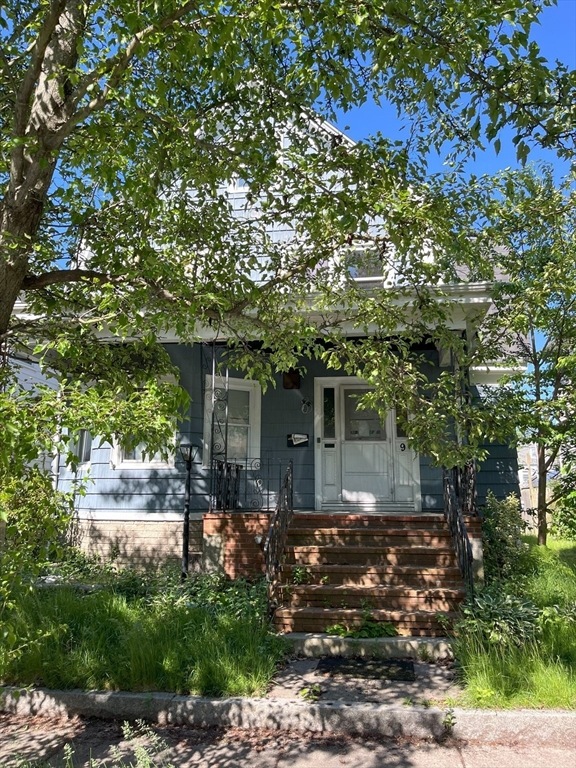


9 N Orchard St New Bedford, MA 02740
Downtown New Bedford Neighborhood
5
Beds
2.5
Baths
2,034
Sq Ft
3,800
Sq Ft Lot
Highlights
- Colonial Architecture
- No HOA
- Heating System Uses Natural Gas
- 2 Fireplaces
About This Home
As of June 20255 bed 2.5 bath. 2 family potentialInvestor special - ready for immediate closing. Quotes for renovation in hand. Must be cash. Quick close preferred.
Last Agent to Sell the Property
Michael Mita
RE/MAX Flagship Listed on: 07/16/2024
Home Details
Home Type
- Single Family
Est. Annual Taxes
- $3,868
Year Built
- Built in 1900
Lot Details
- 3,800 Sq Ft Lot
- Cleared Lot
Parking
- 2 Car Parking Spaces
Home Design
- Colonial Architecture
- Victorian Architecture
- Concrete Perimeter Foundation
Interior Spaces
- 2,034 Sq Ft Home
- 2 Fireplaces
Bedrooms and Bathrooms
- 5 Bedrooms
Utilities
- No Cooling
- Heating System Uses Natural Gas
Community Details
- No Home Owners Association
Listing and Financial Details
- Assessor Parcel Number 2892022
Ownership History
Date
Name
Owned For
Owner Type
Purchase Details
Listed on
Apr 8, 2025
Closed on
Jun 18, 2025
Sold by
Jorge and Madrid Hm
Bought by
Pacheco John A
Seller's Agent
Leilani Paz
RE/MAX Vantage
Buyer's Agent
Molly Armando
Real Broker MA, LLC
List Price
$522,000
Sold Price
$500,000
Premium/Discount to List
-$22,000
-4.21%
Views
70
Home Financials for this Owner
Home Financials are based on the most recent Mortgage that was taken out on this home.
Avg. Annual Appreciation
-18.60%
Original Mortgage
$485,000
Outstanding Balance
$485,000
Interest Rate
6.76%
Mortgage Type
Purchase Money Mortgage
Estimated Equity
$4,816
Purchase Details
Closed on
Jan 29, 2020
Sold by
Mendez Lori A
Bought by
Money Source Inc
Purchase Details
Closed on
Nov 10, 2010
Sold by
Rocha-Alves Tr Michelle and Rocha-Correia Michelle
Bought by
Rocha-Alves Michelle
Purchase Details
Closed on
Jul 31, 1995
Sold by
Conlin Dorothy
Bought by
Correia Michelle R
Similar Homes in New Bedford, MA
Create a Home Valuation Report for This Property
The Home Valuation Report is an in-depth analysis detailing your home's value as well as a comparison with similar homes in the area
Home Values in the Area
Average Home Value in this Area
Purchase History
| Date | Type | Sale Price | Title Company |
|---|---|---|---|
| Deed | $500,000 | None Available | |
| Foreclosure Deed | $176,300 | None Available | |
| Foreclosure Deed | $176,300 | None Available | |
| Deed | -- | -- | |
| Deed | $60,000 | -- | |
| Deed | -- | -- | |
| Deed | $60,000 | -- |
Source: Public Records
Mortgage History
| Date | Status | Loan Amount | Loan Type |
|---|---|---|---|
| Open | $485,000 | Purchase Money Mortgage | |
| Previous Owner | $267,500 | Commercial | |
| Previous Owner | $265,000 | Construction | |
| Previous Owner | $184,000 | Purchase Money Mortgage | |
| Previous Owner | $166,920 | FHA |
Source: Public Records
Property History
| Date | Event | Price | Change | Sq Ft Price |
|---|---|---|---|---|
| 06/18/2025 06/18/25 | Sold | $500,000 | -2.3% | $246 / Sq Ft |
| 05/13/2025 05/13/25 | Pending | -- | -- | -- |
| 04/30/2025 04/30/25 | Price Changed | $512,000 | -1.9% | $252 / Sq Ft |
| 04/08/2025 04/08/25 | For Sale | $522,000 | +88.1% | $257 / Sq Ft |
| 12/02/2024 12/02/24 | Sold | $277,500 | -7.5% | $136 / Sq Ft |
| 10/25/2024 10/25/24 | Pending | -- | -- | -- |
| 07/16/2024 07/16/24 | For Sale | $299,999 | +76.5% | $147 / Sq Ft |
| 06/30/2016 06/30/16 | Sold | $170,000 | 0.0% | $84 / Sq Ft |
| 04/20/2016 04/20/16 | Pending | -- | -- | -- |
| 01/01/2016 01/01/16 | For Sale | $170,000 | -- | $84 / Sq Ft |
Source: MLS Property Information Network (MLS PIN)
Tax History Compared to Growth
Tax History
| Year | Tax Paid | Tax Assessment Tax Assessment Total Assessment is a certain percentage of the fair market value that is determined by local assessors to be the total taxable value of land and additions on the property. | Land | Improvement |
|---|---|---|---|---|
| 2025 | $4,061 | $359,100 | $93,100 | $266,000 |
| 2024 | $3,868 | $322,300 | $86,500 | $235,800 |
| 2023 | $3,817 | $267,100 | $73,200 | $193,900 |
| 2022 | $3,465 | $223,000 | $66,500 | $156,500 |
| 2021 | $3,271 | $209,800 | $63,200 | $146,600 |
| 2020 | $3,269 | $202,300 | $63,200 | $139,100 |
| 2019 | $3,119 | $189,400 | $63,200 | $126,200 |
| 2018 | $2,920 | $175,600 | $63,200 | $112,400 |
| 2017 | $2,801 | $167,800 | $61,500 | $106,300 |
| 2016 | $2,663 | $161,500 | $59,900 | $101,600 |
| 2015 | $2,503 | $159,100 | $59,900 | $99,200 |
| 2014 | $2,377 | $156,800 | $58,200 | $98,600 |
Source: Public Records
Agents Affiliated with this Home
-
Leilani Paz
L
Seller's Agent in 2025
Leilani Paz
RE/MAX
3 in this area
11 Total Sales
-
Molly Armando
Buyer's Agent in 2025
Molly Armando
Real Broker MA, LLC
(508) 863-1015
11 in this area
86 Total Sales
-
M
Seller's Agent in 2024
Michael Mita
RE/MAX
-
Team Silva
Buyer's Agent in 2024
Team Silva
Silva Realty Group, Inc.
(508) 297-8287
4 in this area
17 Total Sales
-
Tony Melo
Seller's Agent in 2016
Tony Melo
Trident Realty Group
(508) 369-9755
22 Total Sales
-
C
Buyer's Agent in 2016
Cynthia Barao
Berkshire Hathaway Home Services - Mel Antonio Real Estate
Map
Source: MLS Property Information Network (MLS PIN)
MLS Number: 73265439
APN: NEWB-000052-000000-000351
Disclaimer: Certain information contained herein is derived from information provided by parties other than Homes.com. All information provided is deemed reliable, but is not guaranteed to be accurate and should be independently verified.
![]() The property listing data and information, or the Images, set forth herein were provided to MLS Property Information Network, Inc. from third party sources, including sellers, lessors and public records, and were compiled by MLS Property Information Network, Inc. The property listing data and information, and the Images, are for the personal, non-commercial use of consumers having a good faith interest in purchasing or leasing listed properties of the type displayed to them and may not be used for any purpose other than to identify prospective properties which such consumers may have a good faith interest in purchasing or leasing. MLS Property Information Network, Inc. and its subscribers disclaim any and all representations and warranties as to the accuracy of the property listing data and information, or as to the accuracy of any of the Images, set forth herein.
The property listing data and information, or the Images, set forth herein were provided to MLS Property Information Network, Inc. from third party sources, including sellers, lessors and public records, and were compiled by MLS Property Information Network, Inc. The property listing data and information, and the Images, are for the personal, non-commercial use of consumers having a good faith interest in purchasing or leasing listed properties of the type displayed to them and may not be used for any purpose other than to identify prospective properties which such consumers may have a good faith interest in purchasing or leasing. MLS Property Information Network, Inc. and its subscribers disclaim any and all representations and warranties as to the accuracy of the property listing data and information, or as to the accuracy of any of the Images, set forth herein.
Nearby Homes