Estimated Value: $1,131,000 - $1,513,000
3
Beds
3
Baths
3,548
Sq Ft
$384/Sq Ft
Est. Value
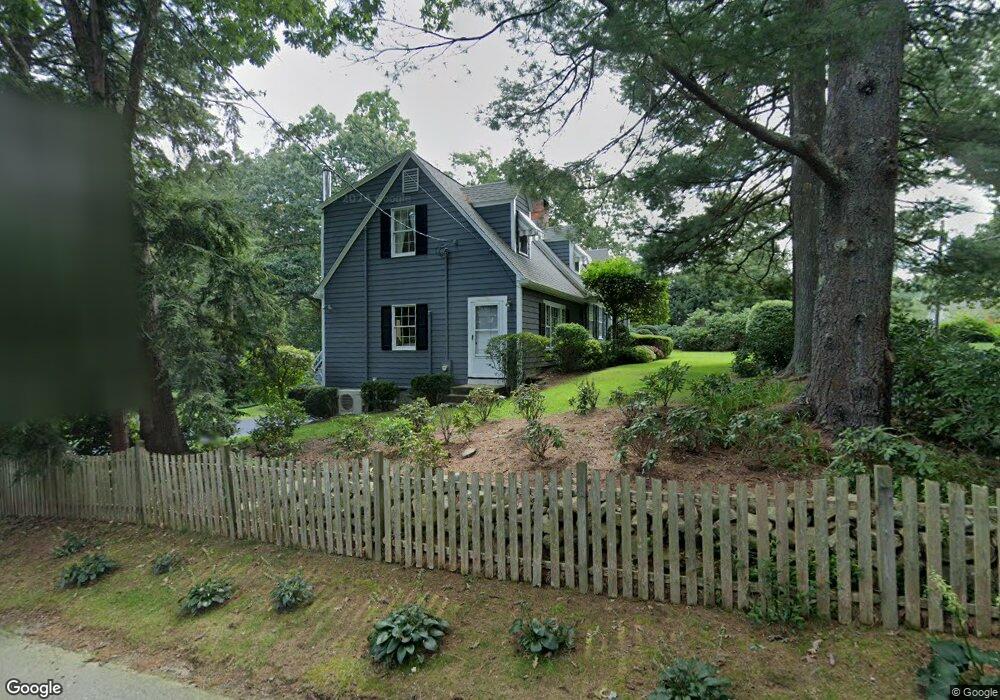
About This Home
This home is located at 9 Oakley Rd, Dover, MA 02030 and is currently estimated at $1,362,618, approximately $384 per square foot. 9 Oakley Rd is a home located in Norfolk County with nearby schools including Chickering Elementary School, Dover-Sherborn Regional Middle School, and Dover-Sherborn Regional High School.
Create a Home Valuation Report for This Property
The Home Valuation Report is an in-depth analysis detailing your home's value as well as a comparison with similar homes in the area
Home Values in the Area
Average Home Value in this Area
Tax History
| Year | Tax Paid | Tax Assessment Tax Assessment Total Assessment is a certain percentage of the fair market value that is determined by local assessors to be the total taxable value of land and additions on the property. | Land | Improvement |
|---|---|---|---|---|
| 2025 | $11,941 | $1,059,500 | $610,900 | $448,600 |
| 2024 | $12,270 | $1,119,500 | $592,300 | $527,200 |
| 2023 | $11,207 | $919,400 | $526,900 | $392,500 |
| 2022 | $10,643 | $856,900 | $508,200 | $348,700 |
| 2021 | $11,045 | $856,900 | $508,200 | $348,700 |
| 2020 | $11,003 | $856,900 | $508,200 | $348,700 |
| 2019 | $11,080 | $856,900 | $508,200 | $348,700 |
| 2018 | $9,888 | $770,100 | $448,200 | $321,900 |
| 2017 | $9,563 | $732,800 | $410,900 | $321,900 |
| 2016 | $9,531 | $740,000 | $410,900 | $329,100 |
| 2015 | $8,744 | $688,500 | $390,300 | $298,200 |
Source: Public Records
Map
Nearby Homes
- 52 Willow St
- 25 Bretton Rd
- 62 Claybrook Rd
- 60 Claybrook Rd
- 1 Mill St
- 1 Old Colony Dr
- 1266 South St
- 1780 Central Ave
- 24 Moseley Ave
- 34 Stratford Rd
- 362 Country Way
- 365 Charles River St
- 62 Walpole St
- 37 Carleton Dr
- 29 Rolling Ln
- 49 Powisset St
- 68 Locust Ln
- 957 South St
- 189 Bridle Trail Rd
- 93 Walpole St
Your Personal Tour Guide
Ask me questions while you tour the home.