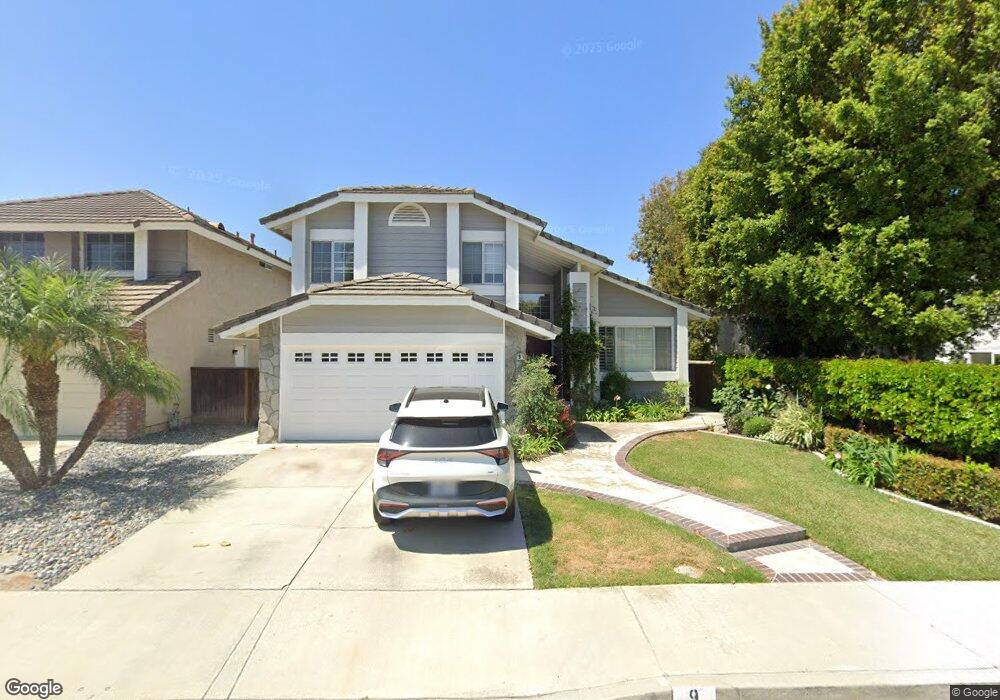
9 Phillipsburg Irvine, CA 92620
Northwood NeighborhoodEstimated Value: $1,739,794 - $1,887,000
4
Beds
3
Baths
2,132
Sq Ft
$842/Sq Ft
Est. Value
About This Home
This home is located at 9 Phillipsburg, Irvine, CA 92620 and is currently estimated at $1,796,199, approximately $842 per square foot. 9 Phillipsburg is a home located in Orange County with nearby schools including Brywood Elementary School, Sierra Vista Middle School, and Northwood High School.
Ownership History
Date
Name
Owned For
Owner Type
Purchase Details
Closed on
Jan 11, 2024
Sold by
Swancoat Mark D and Swancoat Laurene Hansen
Bought by
Swancoat Family Trust and Swancoat
Current Estimated Value
Purchase Details
Closed on
May 29, 2007
Sold by
Crabtree Charles F and Crabtree Sherry A
Bought by
Swancoat Mark D and Swancoat Laurene Hansen
Home Financials for this Owner
Home Financials are based on the most recent Mortgage that was taken out on this home.
Original Mortgage
$442,000
Interest Rate
6.21%
Mortgage Type
Purchase Money Mortgage
Create a Home Valuation Report for This Property
The Home Valuation Report is an in-depth analysis detailing your home's value as well as a comparison with similar homes in the area
Home Values in the Area
Average Home Value in this Area
Purchase History
| Date | Buyer | Sale Price | Title Company |
|---|---|---|---|
| Swancoat Family Trust | -- | None Listed On Document | |
| Swancoat Mark D | $779,000 | Equity Title Company |
Source: Public Records
Mortgage History
| Date | Status | Borrower | Loan Amount |
|---|---|---|---|
| Previous Owner | Swancoat Mark D | $442,000 |
Source: Public Records
Tax History
| Year | Tax Paid | Tax Assessment Tax Assessment Total Assessment is a certain percentage of the fair market value that is determined by local assessors to be the total taxable value of land and additions on the property. | Land | Improvement |
|---|---|---|---|---|
| 2025 | $11,149 | $1,056,612 | $775,655 | $280,957 |
| 2024 | $11,149 | $1,035,895 | $760,446 | $275,449 |
| 2023 | $10,863 | $1,015,584 | $745,535 | $270,049 |
| 2022 | $10,535 | $983,491 | $730,917 | $252,574 |
| 2021 | $10,297 | $964,207 | $716,585 | $247,622 |
| 2020 | $10,239 | $954,321 | $709,238 | $245,083 |
| 2019 | $10,013 | $935,609 | $695,331 | $240,278 |
| 2018 | $9,838 | $917,264 | $681,697 | $235,567 |
| 2017 | $9,123 | $850,000 | $649,938 | $200,062 |
| 2016 | $8,892 | $850,000 | $649,938 | $200,062 |
| 2015 | $8,374 | $800,000 | $599,938 | $200,062 |
| 2014 | $8,373 | $800,000 | $599,938 | $200,062 |
Source: Public Records
Map
Nearby Homes
- 14 Wakefield
- 11 Burke
- 14172 Moore Ct
- 14072 Picasso Ct
- 1 Emperor
- 14272 Saarinen Ct
- 22 Yorktown
- 12 Filare
- 40 Bolinas Unit 5
- 9 Sheridan
- 6 Idyllwild Unit 10
- 14375 Majorca Ave
- 7 Boone
- 3852 Uris Ct
- 3761 Provincetown Ave
- 73 Huntington Unit 322
- 17 Cheyenne Unit 64
- 4161 Old Mill St
- 26 Helena Unit 69
- 127 Huntington Unit 257
Your Personal Tour Guide
Ask me questions while you tour the home.