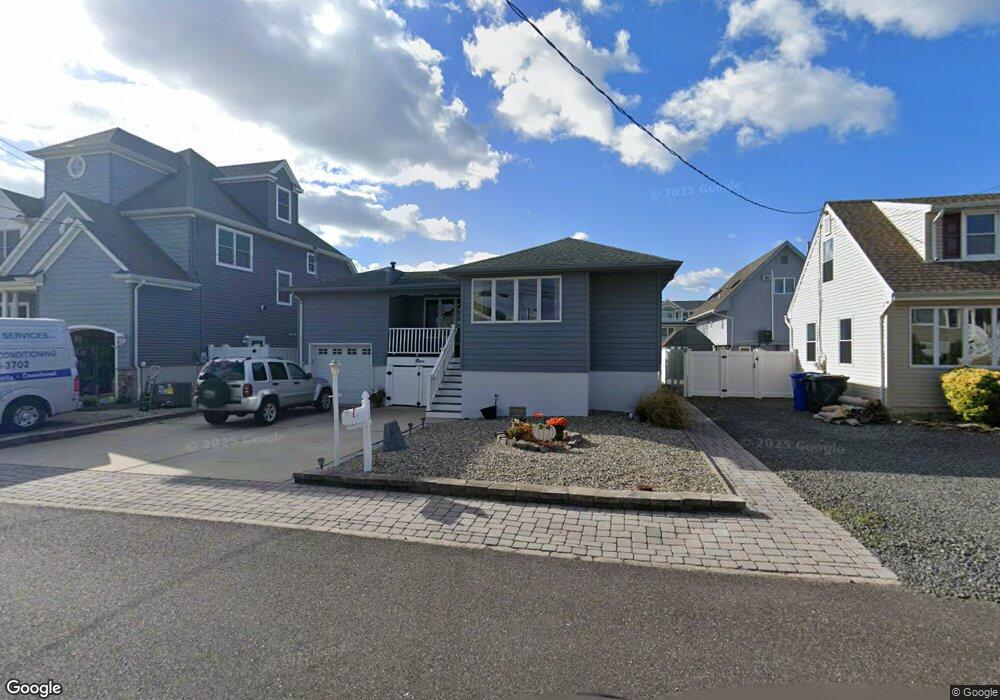
9 Point Rd Toms River, NJ 08753
Estimated Value: $441,327 - $527,000
3
Beds
1
Bath
1,406
Sq Ft
$352/Sq Ft
Est. Value
About This Home
This home is located at 9 Point Rd, Toms River, NJ 08753 and is currently estimated at $495,332, approximately $352 per square foot. 9 Point Rd is a home located in Ocean County with nearby schools including St Joseph Grade School and Donovan Catholic High School.
Ownership History
Date
Name
Owned For
Owner Type
Purchase Details
Closed on
Oct 21, 2002
Sold by
Brooksbank Daniel
Bought by
Shenewolf Maryann
Current Estimated Value
Purchase Details
Closed on
Jan 15, 1998
Sold by
Mcnamara Danny and Mcnamara Anna C
Bought by
Poskay Annemarie
Home Financials for this Owner
Home Financials are based on the most recent Mortgage that was taken out on this home.
Original Mortgage
$100,800
Interest Rate
7.08%
Create a Home Valuation Report for This Property
The Home Valuation Report is an in-depth analysis detailing your home's value as well as a comparison with similar homes in the area
Home Values in the Area
Average Home Value in this Area
Purchase History
| Date | Buyer | Sale Price | Title Company |
|---|---|---|---|
| Shenewolf Maryann | $200,000 | -- | |
| Poskay Annemarie | $112,000 | -- |
Source: Public Records
Mortgage History
| Date | Status | Borrower | Loan Amount |
|---|---|---|---|
| Previous Owner | Poskay Annemarie | $100,800 |
Source: Public Records
Tax History
| Year | Tax Paid | Tax Assessment Tax Assessment Total Assessment is a certain percentage of the fair market value that is determined by local assessors to be the total taxable value of land and additions on the property. | Land | Improvement |
|---|---|---|---|---|
| 2025 | $6,057 | $332,600 | $107,000 | $225,600 |
| 2024 | $5,757 | $332,600 | $107,000 | $225,600 |
Source: Public Records
Map
Nearby Homes
- 19 Point Rd
- 40 Bay Shore Dr Unit A & B
- 39 Bay Shore Dr
- 75 Bay Shore Dr
- 107 Bay Shore Dr
- 215 Fischer Blvd
- 3255 Mystic Port Place
- 3414 Adams Ave
- 3243 Mystic Port Place
- 204 Fischer Blvd
- 100 Fischer Blvd
- 207 Bash Rd
- 3234 Mystic Port Place
- 209 Bash Rd
- 3402 Maritime Dr
- 3445 Maritime Dr
- 212 Swan Blvd
- 3425 Lisbon Ave
- 128 George Rd
- 3451 E Lisbon Ave
Your Personal Tour Guide
Ask me questions while you tour the home.