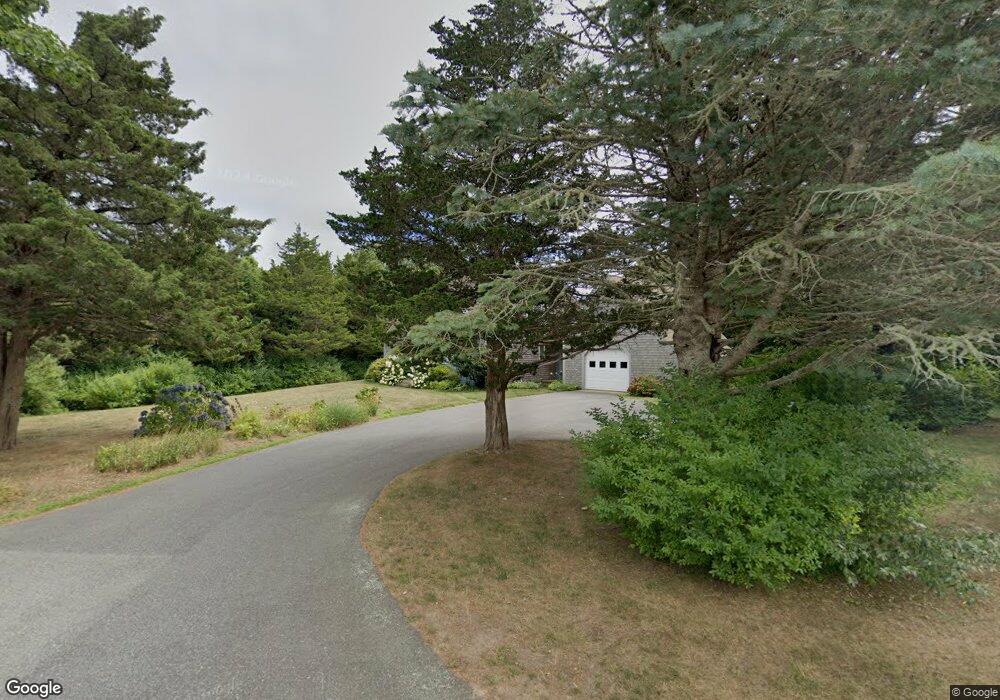
9 Prides Path Orleans, MA 02653
Estimated Value: $3,380,000 - $3,770,000
3
Beds
4
Baths
4,174
Sq Ft
$850/Sq Ft
Est. Value
About This Home
This home is located at 9 Prides Path, Orleans, MA 02653 and is currently estimated at $3,549,539, approximately $850 per square foot. 9 Prides Path is a home located in Barnstable County with nearby schools including Orleans Elementary School, Nauset Regional Middle School, and Nauset Regional High School.
Ownership History
Date
Name
Owned For
Owner Type
Purchase Details
Closed on
Mar 25, 2020
Sold by
Catherine Southworth Ret
Bought by
Chester Jonathan S and Chester Judith A
Current Estimated Value
Home Financials for this Owner
Home Financials are based on the most recent Mortgage that was taken out on this home.
Original Mortgage
$700,000
Outstanding Balance
$620,115
Interest Rate
3.4%
Mortgage Type
Purchase Money Mortgage
Estimated Equity
$2,929,424
Purchase Details
Closed on
Feb 26, 2010
Sold by
Southworth Catherine and Dunford David
Bought by
Southworth Catherine
Home Financials for this Owner
Home Financials are based on the most recent Mortgage that was taken out on this home.
Original Mortgage
$938,250
Interest Rate
5.11%
Mortgage Type
Reverse Mortgage Home Equity Conversion Mortgage
Create a Home Valuation Report for This Property
The Home Valuation Report is an in-depth analysis detailing your home's value as well as a comparison with similar homes in the area
Home Values in the Area
Average Home Value in this Area
Purchase History
| Date | Buyer | Sale Price | Title Company |
|---|---|---|---|
| Chester Jonathan S | $1,800,000 | None Available | |
| Southworth Catherine | -- | -- | |
| Southworth Catherine | -- | -- | |
| Catherine Southworth R | -- | -- |
Source: Public Records
Mortgage History
| Date | Status | Borrower | Loan Amount |
|---|---|---|---|
| Open | Chester Jonathan S | $700,000 | |
| Previous Owner | Catherine Southworth R | $938,250 |
Source: Public Records
Tax History
| Year | Tax Paid | Tax Assessment Tax Assessment Total Assessment is a certain percentage of the fair market value that is determined by local assessors to be the total taxable value of land and additions on the property. | Land | Improvement |
|---|---|---|---|---|
| 2025 | $18,277 | $2,929,000 | $1,177,500 | $1,751,500 |
| 2024 | $17,429 | $2,719,100 | $1,154,300 | $1,564,800 |
| 2023 | $12,995 | $2,085,800 | $1,068,900 | $1,016,900 |
| 2022 | $12,763 | $1,772,700 | $971,800 | $800,900 |
| 2021 | $10,487 | $1,337,600 | $895,400 | $442,200 |
| 2020 | $9,977 | $1,319,700 | $895,400 | $424,300 |
| 2019 | $10,020 | $1,354,000 | $938,100 | $415,900 |
| 2018 | $8,705 | $1,313,000 | $920,000 | $393,000 |
| 2017 | $8,195 | $1,294,700 | $920,000 | $374,700 |
| 2016 | $8,299 | $1,284,700 | $912,400 | $372,300 |
| 2015 | $8,096 | $1,261,000 | $894,300 | $366,700 |
Source: Public Records
Map
Nearby Homes
- 63 Kescayogansett Rd
- 64 Pershing Ln
- 7 Lockwood Ln
- 11 Little Marsh Ln
- 32 Areys Ln
- 142 Monument Rd
- 22 Pilgrim Lake Terrace
- 15 Morgans Way
- 15 Morgan's Way
- 6 Apple Way
- 6 Monomoy Ln
- 4 Monomoy Ln
- 8 Monomoy Ln
- 2 Monomoy Ln
- 15 Dale Ann Dr
- 80 Briar Spring Rd
- 25 Pleasant View Dr
- 449 S Orleans Rd
- 19 Monument Rd
- 47 Daley Terrace
Your Personal Tour Guide
Ask me questions while you tour the home.