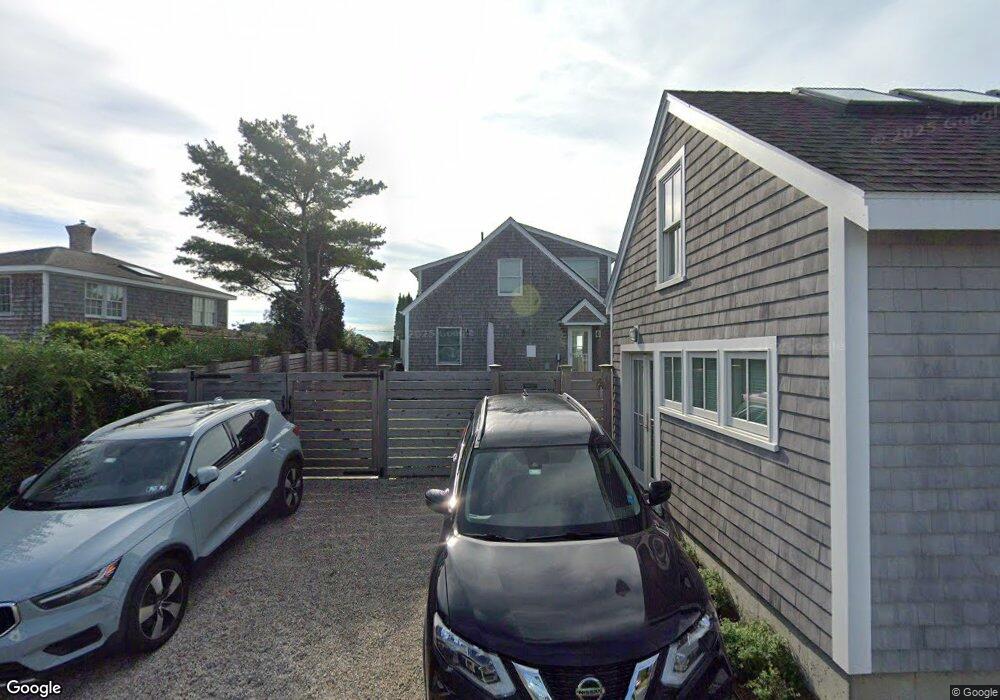
9 Quarry Path Stonington, CT 06378
Estimated Value: $807,000 - $1,333,000
3
Beds
2
Baths
1,348
Sq Ft
$760/Sq Ft
Est. Value
About This Home
This home is located at 9 Quarry Path, Stonington, CT 06378 and is currently estimated at $1,024,100, approximately $759 per square foot. 9 Quarry Path is a home located in New London County with nearby schools including Stonington Middle School, Stonington High School, and Pine Point School.
Ownership History
Date
Name
Owned For
Owner Type
Purchase Details
Closed on
Aug 1, 2012
Sold by
Maguire Ralph P and Maguire Christina L
Bought by
Cardone Anthony and Cardone Emily
Current Estimated Value
Purchase Details
Closed on
Jul 1, 2004
Sold by
Wright Thomas and Wright Bonnie
Bought by
Maguire Ralph and Maguire Christina
Home Financials for this Owner
Home Financials are based on the most recent Mortgage that was taken out on this home.
Original Mortgage
$365,000
Interest Rate
6.3%
Create a Home Valuation Report for This Property
The Home Valuation Report is an in-depth analysis detailing your home's value as well as a comparison with similar homes in the area
Home Values in the Area
Average Home Value in this Area
Purchase History
| Date | Buyer | Sale Price | Title Company |
|---|---|---|---|
| Cardone Anthony | $300,000 | -- | |
| Cardone Anthony | $300,000 | -- | |
| Maguire Ralph | $565,000 | -- | |
| Maguire Ralph | $565,000 | -- |
Source: Public Records
Mortgage History
| Date | Status | Borrower | Loan Amount |
|---|---|---|---|
| Previous Owner | Maguire Ralph | $30,000 | |
| Previous Owner | Maguire Ralph | $365,000 |
Source: Public Records
Tax History
| Year | Tax Paid | Tax Assessment Tax Assessment Total Assessment is a certain percentage of the fair market value that is determined by local assessors to be the total taxable value of land and additions on the property. | Land | Improvement |
|---|---|---|---|---|
| 2025 | $11,477 | $592,200 | $416,500 | $175,700 |
| 2024 | $11,015 | $592,200 | $416,500 | $175,700 |
| 2023 | $11,746 | $634,900 | $416,500 | $218,400 |
| 2022 | $9,755 | $391,600 | $263,700 | $127,900 |
| 2021 | $9,829 | $391,600 | $263,700 | $127,900 |
| 2020 | $9,637 | $391,600 | $263,700 | $127,900 |
| 2019 | $9,637 | $391,600 | $263,700 | $127,900 |
| 2018 | $9,332 | $391,600 | $263,700 | $127,900 |
| 2017 | $8,968 | $373,200 | $269,700 | $103,500 |
| 2016 | $8,718 | $373,200 | $269,700 | $103,500 |
| 2015 | $8,311 | $373,200 | $269,700 | $103,500 |
| 2014 | $7,936 | $373,800 | $269,700 | $104,100 |
Source: Public Records
Map
Nearby Homes
- 50 Ashworth Ave
- 3 Alley Way
- 4 E Neck Rd
- 20 Lambs Way
- 17 Old Stonington Rd
- 75 Montauk Ave
- 12 Elizabeth Ct Unit 12
- 66 Collins Rd
- 4 Northwest St Unit B-12
- 3 Lamberts Ln
- 92 Water St
- 117 Water St
- 95 Water St
- 32 Broadway Ave
- 103 Main St Unit 1103
- 59 Montauk Ave
- 301 Montauk Ave
- 0 Smail St Unit 24066473
- 14 Temple St
- 12 Water St
Your Personal Tour Guide
Ask me questions while you tour the home.