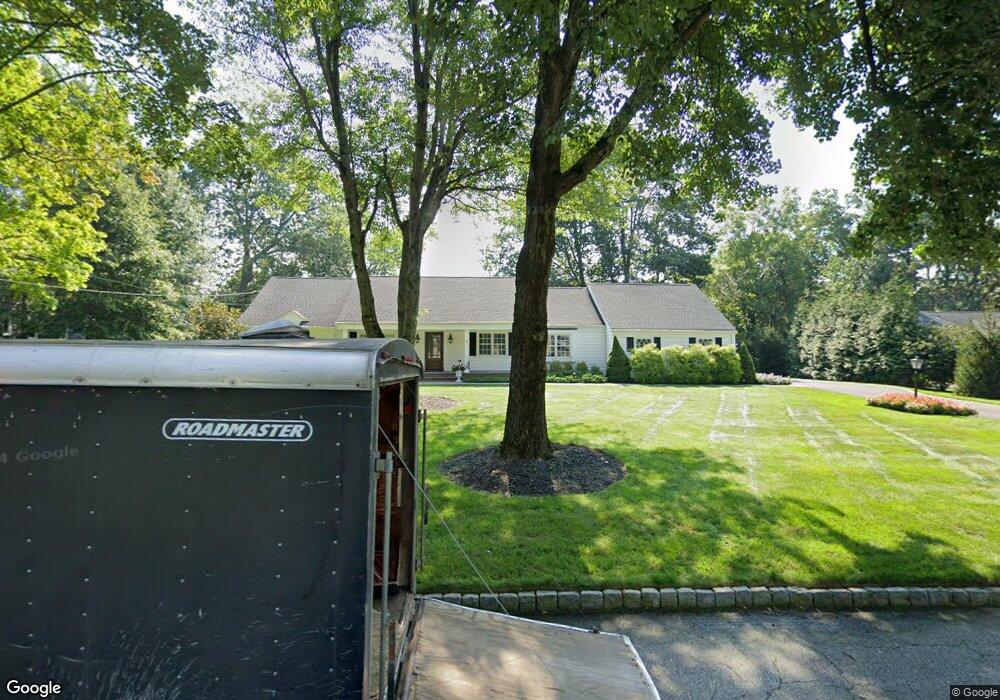
9 Rall Ct Roseland, NJ 07068
Estimated Value: $905,000 - $1,182,000
--
Bed
--
Bath
1,724
Sq Ft
$583/Sq Ft
Est. Value
About This Home
This home is located at 9 Rall Ct, Roseland, NJ 07068 and is currently estimated at $1,004,683, approximately $582 per square foot. 9 Rall Ct is a home located in Essex County with nearby schools including West Essex Middle School, West Essex High School, and Trinity Academy.
Ownership History
Date
Name
Owned For
Owner Type
Purchase Details
Closed on
Aug 27, 2010
Sold by
Watson Frances B
Bought by
Gazek Rachel and Gazek Giordano,Joseph
Current Estimated Value
Home Financials for this Owner
Home Financials are based on the most recent Mortgage that was taken out on this home.
Original Mortgage
$399,000
Interest Rate
4.55%
Mortgage Type
New Conventional
Purchase Details
Closed on
Jul 29, 2009
Sold by
Watson Frances B
Bought by
Watson Frances B
Create a Home Valuation Report for This Property
The Home Valuation Report is an in-depth analysis detailing your home's value as well as a comparison with similar homes in the area
Home Values in the Area
Average Home Value in this Area
Purchase History
| Date | Buyer | Sale Price | Title Company |
|---|---|---|---|
| Gazek Rachel | $535,000 | -- | |
| Watson Frances B | -- | None Available |
Source: Public Records
Mortgage History
| Date | Status | Borrower | Loan Amount |
|---|---|---|---|
| Previous Owner | Gazek Rachel | $399,000 |
Source: Public Records
Tax History Compared to Growth
Tax History
| Year | Tax Paid | Tax Assessment Tax Assessment Total Assessment is a certain percentage of the fair market value that is determined by local assessors to be the total taxable value of land and additions on the property. | Land | Improvement |
|---|---|---|---|---|
| 2025 | $11,786 | $679,400 | $374,500 | $304,900 |
| 2024 | $11,786 | $679,400 | $374,500 | $304,900 |
| 2022 | $11,887 | $509,100 | $344,000 | $165,100 |
| 2021 | $11,725 | $509,100 | $344,000 | $165,100 |
| 2020 | $11,684 | $509,100 | $344,000 | $165,100 |
| 2019 | $11,577 | $509,100 | $344,000 | $165,100 |
| 2018 | $11,475 | $509,100 | $344,000 | $165,100 |
| 2017 | $11,470 | $509,100 | $344,000 | $165,100 |
| 2016 | $11,292 | $509,100 | $344,000 | $165,100 |
| 2015 | $11,317 | $509,100 | $344,000 | $165,100 |
| 2014 | $11,002 | $509,100 | $344,000 | $165,100 |
Source: Public Records
Map
Nearby Homes