Estimated Value: $715,740 - $800,000
4
Beds
3
Baths
3,000
Sq Ft
$250/Sq Ft
Est. Value
About This Home
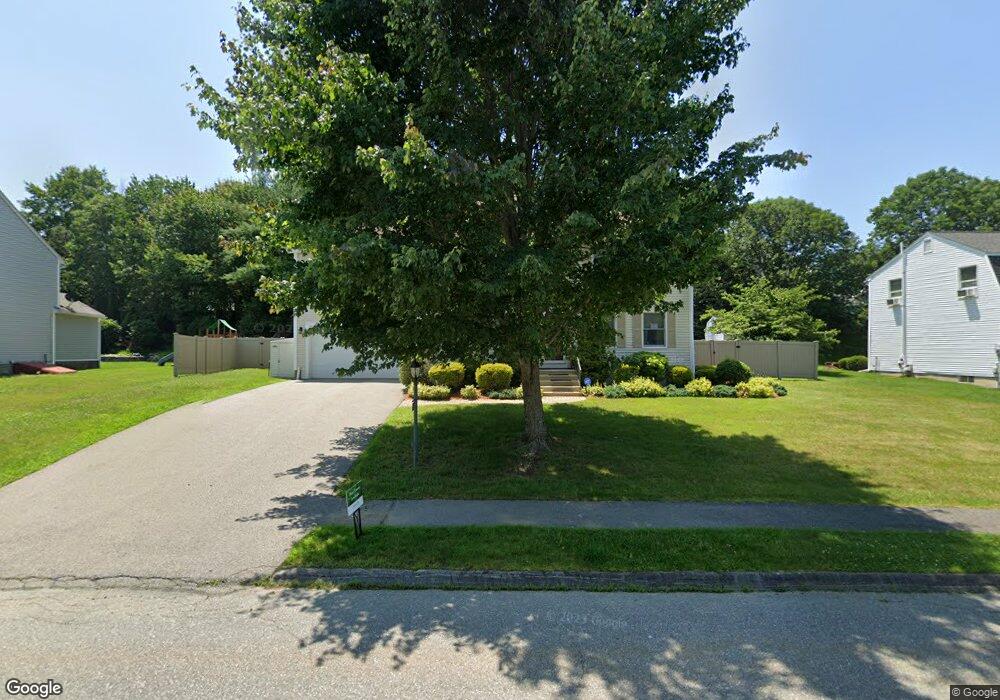
This home is located at 9 Robbins Rd Unit 1, Ayer, MA 01432 and is currently estimated at $750,685, approximately $250 per square foot. 9 Robbins Rd Unit 1 is a home located in Middlesex County with nearby schools including Page Hilltop School, Lura A. White Elementary School, and Ayer Shirley Regional Middle School.
Ownership History
Date
Name
Owned For
Owner Type
Purchase Details
Closed on
Jan 31, 2002
Sold by
Wasfy Ayman
Bought by
Fatzinger David D and Fatzinger Ines F
Current Estimated Value
Home Financials for this Owner
Home Financials are based on the most recent Mortgage that was taken out on this home.
Original Mortgage
$260,000
Outstanding Balance
$103,705
Interest Rate
7.15%
Mortgage Type
Purchase Money Mortgage
Estimated Equity
$646,980
Purchase Details
Closed on
Nov 30, 1999
Sold by
Hayes Kurt G and Hayes Deborah H
Bought by
Wasfy Ayman
Home Financials for this Owner
Home Financials are based on the most recent Mortgage that was taken out on this home.
Original Mortgage
$218,000
Interest Rate
7.77%
Mortgage Type
Purchase Money Mortgage
Purchase Details
Closed on
Sep 11, 1995
Sold by
Bruce Homes Inc
Bought by
Hayes Kurt G and Hayes Deborah H
Create a Home Valuation Report for This Property
The Home Valuation Report is an in-depth analysis detailing your home's value as well as a comparison with similar homes in the area
Home Values in the Area
Average Home Value in this Area
Purchase History
| Date | Buyer | Sale Price | Title Company |
|---|---|---|---|
| Fatzinger David D | $325,000 | -- | |
| Fatzinger David D | $325,000 | -- | |
| Wasfy Ayman | $242,500 | -- | |
| Hayes Kurt G | $55,000 | -- |
Source: Public Records
Mortgage History
| Date | Status | Borrower | Loan Amount |
|---|---|---|---|
| Open | Fatzinger David D | $260,000 | |
| Closed | Hayes Kurt G | $260,000 | |
| Previous Owner | Hayes Kurt G | $218,000 | |
| Previous Owner | Hayes Kurt G | $40,000 |
Source: Public Records
Tax History
| Year | Tax Paid | Tax Assessment Tax Assessment Total Assessment is a certain percentage of the fair market value that is determined by local assessors to be the total taxable value of land and additions on the property. | Land | Improvement |
|---|---|---|---|---|
| 2025 | $7,744 | $647,500 | $174,000 | $473,500 |
| 2024 | $7,379 | $602,400 | $174,000 | $428,400 |
| 2023 | $6,912 | $556,500 | $163,100 | $393,400 |
| 2022 | $6,722 | $500,900 | $142,300 | $358,600 |
| 2021 | $4,523 | $470,800 | $133,600 | $337,200 |
| 2020 | $6,410 | $454,600 | $128,300 | $326,300 |
| 2019 | $6,045 | $443,500 | $122,300 | $321,200 |
| 2018 | $6,156 | $426,600 | $118,600 | $308,000 |
| 2017 | $5,828 | $405,000 | $115,200 | $289,800 |
| 2016 | $5,620 | $386,800 | $114,900 | $271,900 |
| 2015 | $5,637 | $385,600 | $114,900 | $270,700 |
| 2014 | $5,360 | $380,700 | $114,900 | $265,800 |
Source: Public Records
Map
Nearby Homes
- 55 Littleton Rd Unit 21C
- 78 Shaker Rd
- 17 Chestnut Ln
- 47 Longview Cir Unit C
- 5 Bayberry Ln Unit B
- 75 Sandy Pond Rd Unit 24
- 75 Sandy Pond Rd Unit 41
- 239 Ayer Rd Unit 16
- 239 Ayer Rd Unit 46
- 37 Willard St
- 4 Spectacle Pond Rd
- 24 Harvard Rd Unit C
- 7 Baldwin Ct Unit 7
- 25 Pine Ridge Dr
- 5 Oak Ridge Rd
- 0 Ayer Rd
- 100 Central Ave Unit 4
- 0 Ayer & Old Mill Rd
- 18A S Shaker Rd
- 63 E Main St
Your Personal Tour Guide
Ask me questions while you tour the home.