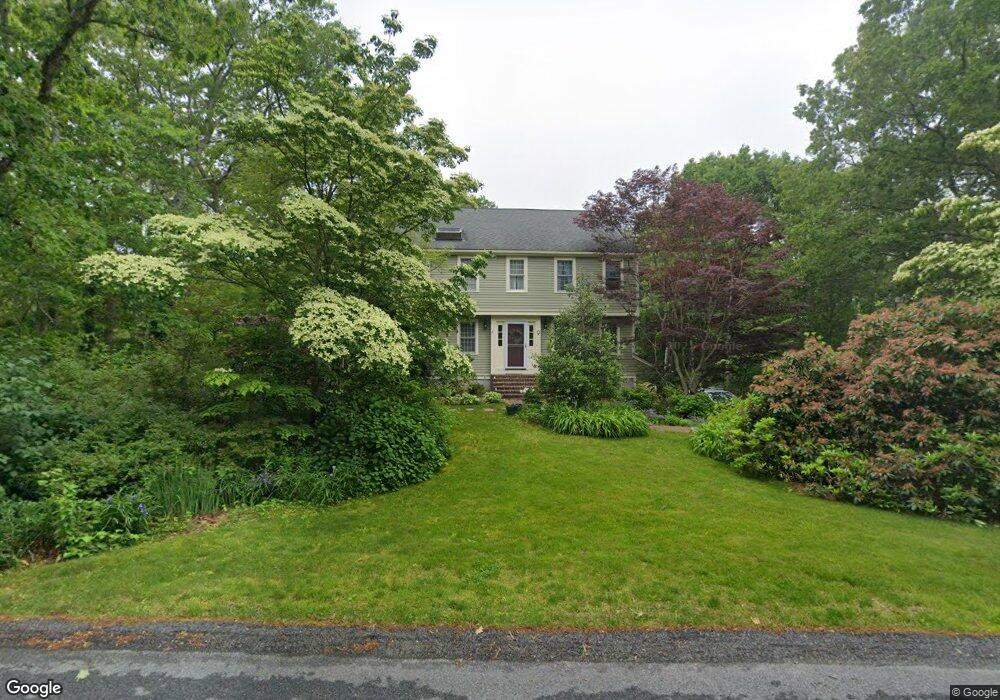
9 Robin Rd Sandwich, MA 02563
Estimated Value: $715,000 - $837,000
4
Beds
3
Baths
2,201
Sq Ft
$358/Sq Ft
Est. Value
About This Home
This home is located at 9 Robin Rd, Sandwich, MA 02563 and is currently estimated at $788,355, approximately $358 per square foot. 9 Robin Rd is a home located in Barnstable County with nearby schools including Sandwich Middle High School, Sandwich Montessori School, and Waldorf School of Cape Cod.
Ownership History
Date
Name
Owned For
Owner Type
Purchase Details
Closed on
May 15, 1998
Sold by
J&S Rt and Scalese Jeannette E
Bought by
Wiklund Mark A and Wiklund Maureen M
Current Estimated Value
Home Financials for this Owner
Home Financials are based on the most recent Mortgage that was taken out on this home.
Original Mortgage
$205,780
Outstanding Balance
$40,138
Interest Rate
7.08%
Mortgage Type
Purchase Money Mortgage
Estimated Equity
$748,217
Create a Home Valuation Report for This Property
The Home Valuation Report is an in-depth analysis detailing your home's value as well as a comparison with similar homes in the area
Purchase History
| Date | Buyer | Sale Price | Title Company |
|---|---|---|---|
| Wiklund Mark A | $228,900 | -- |
Source: Public Records
Mortgage History
| Date | Status | Borrower | Loan Amount |
|---|---|---|---|
| Open | Wiklund Mark A | $205,780 |
Source: Public Records
Tax History
| Year | Tax Paid | Tax Assessment Tax Assessment Total Assessment is a certain percentage of the fair market value that is determined by local assessors to be the total taxable value of land and additions on the property. | Land | Improvement |
|---|---|---|---|---|
| 2025 | $7,697 | $728,200 | $194,300 | $533,900 |
| 2024 | $7,349 | $680,500 | $173,500 | $507,000 |
| 2023 | $6,975 | $606,500 | $139,200 | $467,300 |
| 2022 | $6,925 | $526,200 | $149,100 | $377,100 |
| 2021 | $6,486 | $471,000 | $135,400 | $335,600 |
| 2020 | $6,670 | $466,100 | $147,800 | $318,300 |
| 2019 | $6,304 | $440,200 | $141,300 | $298,900 |
| 2018 | $0 | $403,600 | $125,400 | $278,200 |
| 2017 | $5,482 | $367,200 | $107,100 | $260,100 |
| 2016 | $4,999 | $345,500 | $89,100 | $256,400 |
| 2015 | $5,329 | $359,600 | $108,200 | $251,400 |
Source: Public Records
Map
Nearby Homes
Your Personal Tour Guide
Ask me questions while you tour the home.