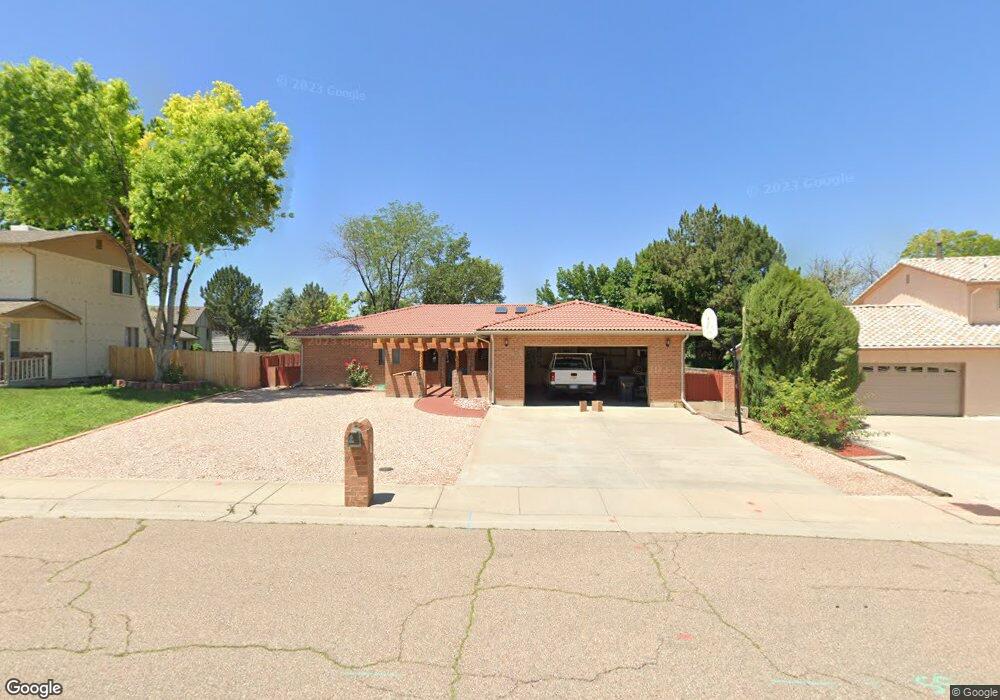
9 Rockbridge Ln Pueblo, CO 81001
Belmont NeighborhoodEstimated Value: $336,847 - $384,000
3
Beds
2
Baths
1,965
Sq Ft
$182/Sq Ft
Est. Value
About This Home
This home is located at 9 Rockbridge Ln, Pueblo, CO 81001 and is currently estimated at $357,462, approximately $181 per square foot. 9 Rockbridge Ln is a home located in Pueblo County with nearby schools including Belmont Elementary School, Heaton Middle School, and East High School.
Ownership History
Date
Name
Owned For
Owner Type
Purchase Details
Closed on
Oct 19, 2010
Sold by
Lopez Adelyn M
Bought by
Jimenez Rafael
Current Estimated Value
Home Financials for this Owner
Home Financials are based on the most recent Mortgage that was taken out on this home.
Original Mortgage
$171,000
Outstanding Balance
$113,014
Interest Rate
4.38%
Mortgage Type
New Conventional
Estimated Equity
$244,448
Purchase Details
Closed on
Mar 9, 1990
Sold by
Martinez Raoul R +
Bought by
Lopez Thomas + Adelyn M
Purchase Details
Closed on
May 3, 1988
Sold by
Ghini Aaron G + Carol M
Bought by
Martinez Raoul R +
Purchase Details
Closed on
Jan 18, 1985
Bought by
Ghini Aaron G + Car
Purchase Details
Closed on
Feb 1, 1980
Bought by
Kaufman C Josephine
Purchase Details
Closed on
Sep 18, 1979
Bought by
Same
Purchase Details
Closed on
Aug 10, 1979
Bought by
Kaufman Agency + Phillips Jam
Purchase Details
Closed on
Feb 28, 1979
Bought by
Kaufman Agency Inc + Phillips
Create a Home Valuation Report for This Property
The Home Valuation Report is an in-depth analysis detailing your home's value as well as a comparison with similar homes in the area
Home Values in the Area
Average Home Value in this Area
Purchase History
| Date | Buyer | Sale Price | Title Company |
|---|---|---|---|
| Jimenez Rafael | $190,000 | Land Title Guarantee Company | |
| Lopez Thomas + Adelyn M | $115,500 | -- | |
| Martinez Raoul R + | $115,000 | -- | |
| Ghini Aaron G + Car | $11,000 | -- | |
| Kaufman C Josephine | -- | -- | |
| Same | -- | -- | |
| Kaufman Agency + Phillips Jam | -- | -- | |
| Kaufman Agency Inc + Phillips | $12,000 | -- |
Source: Public Records
Mortgage History
| Date | Status | Borrower | Loan Amount |
|---|---|---|---|
| Open | Jimenez Rafael | $171,000 |
Source: Public Records
Tax History Compared to Growth
Tax History
| Year | Tax Paid | Tax Assessment Tax Assessment Total Assessment is a certain percentage of the fair market value that is determined by local assessors to be the total taxable value of land and additions on the property. | Land | Improvement |
|---|---|---|---|---|
| 2024 | $1,206 | $18,850 | -- | -- |
| 2023 | $1,219 | $22,540 | $1,680 | $20,860 |
| 2022 | $1,358 | $20,500 | $1,740 | $18,760 |
| 2021 | $1,401 | $21,090 | $1,790 | $19,300 |
| 2020 | $1,752 | $21,090 | $1,790 | $19,300 |
| 2019 | $1,753 | $17,360 | $1,502 | $15,858 |
| 2018 | $1,356 | $14,964 | $1,512 | $13,452 |
| 2017 | $1,370 | $14,964 | $1,512 | $13,452 |
| 2016 | $1,397 | $15,372 | $1,672 | $13,700 |
| 2015 | $696 | $15,372 | $1,672 | $13,700 |
| 2014 | $680 | $14,986 | $1,672 | $13,314 |
Source: Public Records
Map
Nearby Homes
- 6 Crownbridge Ct
- 146 Montebello Rd
- 13 Ironbridge Ln
- 136 Douglas Ln
- 146 Douglas Ln
- 130 Scotland Rd Unit D
- 172 Bonnymede Rd
- 172 Bonnymede Rd Unit A
- 172 Bonnymede Rd Unit C
- 55 Bonnymede Rd Unit S
- 55 Bonnymede Rd
- 6 Pineridge Ct
- 2 Alan Shepard Rd Unit 8
- 2 Hilton Ln
- 39 Apollo Ln
- 5 Douglas Ln
- 1 Mayweed Ct
- 4230 Blueflax Dr
- 36 Scotland Rd
- 1138 Bluestem Blvd
- 7 Rockbridge Ln
- 11 Rockbridge Ln
- 10 Baybridge Ct
- 21 Bellita Dr
- 8 Baybridge Ct
- 12 Baybridge Ct
- 5 Rockbridge Ln
- 10 Rockbridge Ln
- 23 Bellita Dr
- 8 Rockbridge Ln
- 12 Rockbridge Ln
- 6 Baybridge Ct
- 6 Rockbridge Ln
- 3 Rockbridge Ln
- 25 Bellita Dr
- 11 Baybridge Ct
- 2 Crownbridge Ct
- 14 Bellita Dr
- 4 Baybridge Ct
- 4 Rockbridge Ln