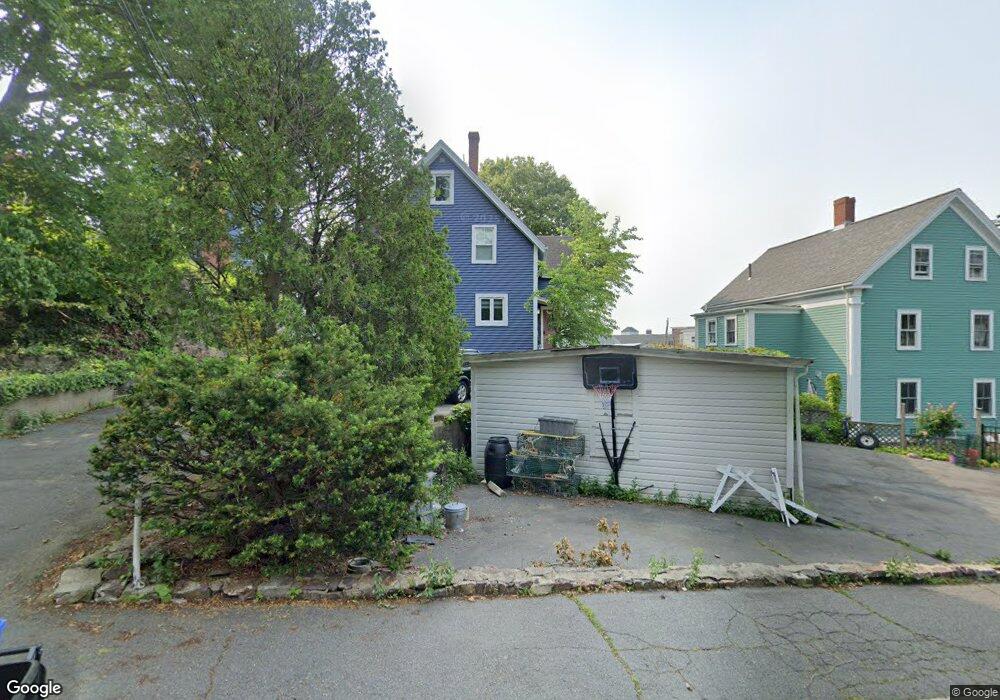
9 Rose St Swampscott, MA 01907
Estimated Value: $747,000 - $933,000
4
Beds
2
Baths
2,000
Sq Ft
$429/Sq Ft
Est. Value
About This Home
This home is located at 9 Rose St, Swampscott, MA 01907 and is currently estimated at $857,384, approximately $428 per square foot. 9 Rose St is a home located in Essex County with nearby schools including Swampscott Middle School and Swampscott High School.
Ownership History
Date
Name
Owned For
Owner Type
Purchase Details
Closed on
Apr 11, 2014
Sold by
Caponigro Joseph and Caponigro Carlo
Bought by
Caponigro Eugene A and Caponigro Joseph
Current Estimated Value
Purchase Details
Closed on
Aug 31, 2012
Sold by
Caponigro Eugene A and Caponigro Joseph
Bought by
Caponigro Joseph and Caponigro Carlo
Purchase Details
Closed on
Aug 27, 2008
Sold by
Parks Judith Est and Glass
Bought by
Caponigro Eugene A and Caponigro Joseph
Home Financials for this Owner
Home Financials are based on the most recent Mortgage that was taken out on this home.
Original Mortgage
$290,442
Interest Rate
6.29%
Mortgage Type
Purchase Money Mortgage
Create a Home Valuation Report for This Property
The Home Valuation Report is an in-depth analysis detailing your home's value as well as a comparison with similar homes in the area
Home Values in the Area
Average Home Value in this Area
Purchase History
| Date | Buyer | Sale Price | Title Company |
|---|---|---|---|
| Caponigro Eugene A | -- | -- | |
| Caponigro Eugene A | -- | -- | |
| Caponigro Joseph | -- | -- | |
| Caponigro Joseph | -- | -- | |
| Caponigro Eugene A | $295,000 | -- | |
| Caponigro Eugene A | $295,000 | -- |
Source: Public Records
Mortgage History
| Date | Status | Borrower | Loan Amount |
|---|---|---|---|
| Previous Owner | Caponigro Eugene A | $290,442 |
Source: Public Records
Tax History Compared to Growth
Tax History
| Year | Tax Paid | Tax Assessment Tax Assessment Total Assessment is a certain percentage of the fair market value that is determined by local assessors to be the total taxable value of land and additions on the property. | Land | Improvement |
|---|---|---|---|---|
| 2025 | $9,429 | $822,100 | $344,500 | $477,600 |
| 2024 | $9,116 | $793,400 | $327,700 | $465,700 |
| 2023 | $8,514 | $725,200 | $294,100 | $431,100 |
| 2022 | $8,352 | $651,000 | $252,100 | $398,900 |
| 2021 | $8,305 | $601,800 | $235,300 | $366,500 |
| 2020 | $7,475 | $522,700 | $210,100 | $312,600 |
| 2019 | $7,626 | $501,700 | $189,100 | $312,600 |
| 2018 | $7,400 | $462,500 | $172,300 | $290,200 |
| 2017 | $7,577 | $434,200 | $161,300 | $272,900 |
| 2016 | $7,338 | $423,400 | $161,300 | $262,100 |
| 2015 | $7,261 | $423,400 | $161,300 | $262,100 |
| 2014 | $6,721 | $359,400 | $134,500 | $224,900 |
Source: Public Records
Map
Nearby Homes
- 140 Elmwood Rd
- 71 Greenwood Ave Unit 207
- 28 Claremont Terrace Unit 4
- 28 Claremont Terrace Unit 6
- 13 Cedar Hill Terrace Unit 2
- 75 Bay View Dr
- 108-110 Burrill St Unit 1
- 21 Bay View Dr
- 7-9 Rock Ave
- 30 Paradise Rd
- 98 Paradise Rd
- 8 Ocean View Rd
- 189 Burrill St Unit 2
- 80 Norfolk Ave Unit 1
- 106 Norfolk Ave
- 71 Walnut Rd
- 2 Peirce Rd
- 133 Eastern Ave Unit 8
- 46 Wardwell Ave
- 306 Paradise Rd
- 9 Rose St Unit 2
- 9 Rose St Unit 2
- 9 Rose St Unit 9
- 7 Rose St
- 29 Blaney St
- 27 Blaney St
- 27 Blaney St Unit 2
- 27 Blaney St Unit 1
- 27 Rockland St
- 29 Rockland St
- 21 Blaney St
- 21 Blaney St Unit 2
- 21 Blaney St Unit 1
- 30 Blaney St
- 30 Blaney St
- 17 Blaney St
- 17 Rockland St
- 17 Rockland St Unit 1
- 28 Blaney St
- 39 Blaney St