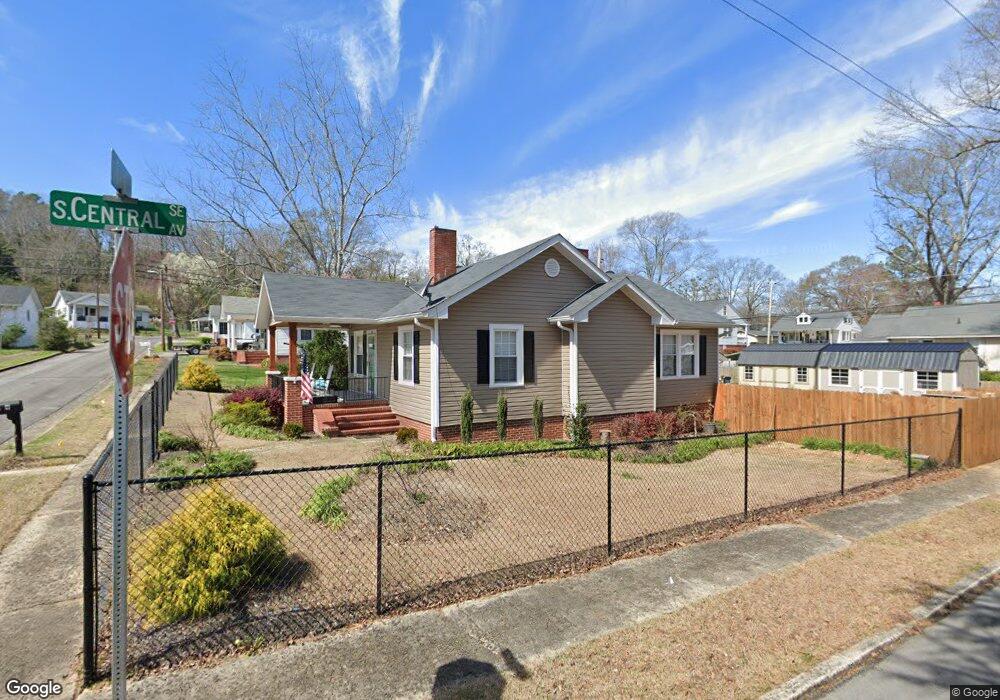
9 S 3rd St SE Lindale, GA 30147
Estimated Value: $193,000 - $209,000
2
Beds
1
Bath
1,114
Sq Ft
$178/Sq Ft
Est. Value
About This Home
This home is located at 9 S 3rd St SE, Lindale, GA 30147 and is currently estimated at $198,559, approximately $178 per square foot. 9 S 3rd St SE is a home located in Floyd County with nearby schools including Pepperell Middle School, Pepperell High School, and Montessori School of Rome.
Ownership History
Date
Name
Owned For
Owner Type
Purchase Details
Closed on
May 29, 2020
Sold by
Collins Wesley J
Bought by
Baker Paul E
Current Estimated Value
Home Financials for this Owner
Home Financials are based on the most recent Mortgage that was taken out on this home.
Original Mortgage
$60,000
Outstanding Balance
$47,009
Interest Rate
3.3%
Mortgage Type
New Conventional
Estimated Equity
$151,550
Purchase Details
Closed on
Dec 15, 2006
Sold by
Not Provided
Bought by
Collins Wesley J
Home Financials for this Owner
Home Financials are based on the most recent Mortgage that was taken out on this home.
Original Mortgage
$65,000
Interest Rate
6.19%
Mortgage Type
New Conventional
Purchase Details
Closed on
Nov 21, 1986
Sold by
Gray Mark D and Green Susan D
Bought by
Gray Steven Milton
Purchase Details
Closed on
Dec 18, 1978
Sold by
Milton Ralph Oscar
Bought by
Gray Mark D and Green Susan D
Purchase Details
Closed on
Nov 30, 1978
Sold by
Botts Mm
Bought by
Milton Ralph Oscar
Purchase Details
Closed on
Jan 1, 1901
Bought by
Botts Mm
Create a Home Valuation Report for This Property
The Home Valuation Report is an in-depth analysis detailing your home's value as well as a comparison with similar homes in the area
Home Values in the Area
Average Home Value in this Area
Purchase History
| Date | Buyer | Sale Price | Title Company |
|---|---|---|---|
| Baker Paul E | $85,000 | -- | |
| Collins Wesley J | $85,000 | -- | |
| Gray Steven Milton | $28,000 | -- | |
| Gray Mark D | -- | -- | |
| Milton Ralph Oscar | -- | -- | |
| Botts Mm | -- | -- |
Source: Public Records
Mortgage History
| Date | Status | Borrower | Loan Amount |
|---|---|---|---|
| Open | Baker Paul E | $60,000 | |
| Previous Owner | Collins Wesley J | $65,000 |
Source: Public Records
Tax History
| Year | Tax Paid | Tax Assessment Tax Assessment Total Assessment is a certain percentage of the fair market value that is determined by local assessors to be the total taxable value of land and additions on the property. | Land | Improvement |
|---|---|---|---|---|
| 2025 | $1,155 | $77,299 | $5,672 | $71,627 |
| 2024 | $1,155 | $78,907 | $5,156 | $73,751 |
| 2023 | $1,059 | $72,771 | $4,583 | $68,188 |
| 2022 | $410 | $39,688 | $3,724 | $35,964 |
| 2021 | $417 | $35,800 | $3,724 | $32,076 |
| 2020 | $1,050 | $32,996 | $2,864 | $30,132 |
| 2019 | $947 | $30,112 | $2,864 | $27,248 |
| 2018 | $890 | $28,233 | $2,864 | $25,369 |
| 2017 | $857 | $27,085 | $2,864 | $24,221 |
| 2016 | $894 | $27,920 | $2,840 | $25,080 |
| 2015 | $874 | $27,920 | $2,840 | $25,080 |
| 2014 | $874 | $27,920 | $2,840 | $25,080 |
Source: Public Records
Map
Nearby Homes
- 1 Van Tassel Dr SE
- 13 N Terrace Ave SE
- 17 N Terrace Ave SE
- 311 Park Ave SE
- 305 Grove Ave SE
- 10 N Hillcrest Dr SE
- 6 Hillside Ave SE
- 0 2nd St- Lindale Ave
- 0 Edenfield Dr SE Unit 21222627
- 220 Avenue D SE
- 280 Ravenwood Dr SE
- 17 Brooke Ct SE
- 1 Longbrooke Dr SE
- 0 Fullbright Dr SE Unit 10531900
- 0 Fullbright Dr SE Unit 7587938
- The Benson II Plan at Longbrooke
- 27 Hughes Dairy Rd SE
- 20 Busby Dr SE
- 0 Ravenwood Dr SE Unit 10668870
- 0 Ravenwood Dr SE Unit 7701514
- 11 S 3rd St SE
- 12 S 2nd St SE
- 7 S 3rd St SE
- 12 S 3rd St SE
- 12 S 3rd - Lindale St
- 14 S 2nd St SE
- 14 S 3rd St SE
- 10 S 2nd St SE
- 13 S 3rd St SE
- 10 S 3rd St SE
- 16 S 3rd St SE
- 5 S 3rd St SE
- 16 S 2nd St SE
- 16 S 2nd St SE
- 8 S 2nd St SE
- 11 S 4th St SE
- 13 S 4th St SE
- 8 S 3rd St SE
- S S Terrace Ave
- 9 S 4th St SE